徐泽源 , 罗庆辉, 许仲林
新疆大学,乌鲁木齐 830046
XU Zeyuan, LUO Qinghui, XU Zhonglin
通讯作者:
收稿日期: 2018-11-20
修回日期: 2019-01-6
网络出版日期: 2019-03-15
版权声明: 2019 《地球信息科学学报》编辑部 《地球信息科学学报》编辑部 所有
基金资助:
作者简介:
作者简介:徐泽源(1995-),男,河南辉县人,硕士生,研究方向为遥感与环境变化研究。E-mail: xuzeyuan789@163.com
展开
摘要
鉴于新疆地区对中国乃至中亚有着特殊的战略意义,本文针对不同数据源及分类系统在土地覆被数据的空间分布上缺乏互通性问题,结合2010年目视解译土地利用现状遥感监测数据、GlobeLand30和GlobCover2009共3种土地覆被数据,采用类型相似分析、类型混淆分析、混淆矩阵分析、空间一致性分析4种方法开展精度评价及一致性分析,以期对土地覆被数据在中国西北干旱区的适用性及适用范围提供有效建议。结果表明,3种土地覆被数据对新疆地区土地覆被类型构成基本一致,且对裸地类型的辨识度最高;新疆地区中高度一致区域占新疆总面积的95%;3种数据两两对比时,总体精度在64.11%~72.57%之间,其中目视解译数据/GlobeLand 30组合表现出最高水平,且仍有提高空间,反映出目前相同卫星传感器是提升精度评价结果的重要因素之一,且不同分类系统、分类方法、空间分辨率及卫星过境时间等因素对精度评价结果也会产生巨大影响。为解决此类问题,利用多源土地覆被遥感数据的融合技术提高数据精度,或是利用深度学习对遥感影像资料进行精确地解译和判读,将是今后全球土地覆被制图及应用领域的主要发展趋势。
关键词:
Abstract
Xinjiang region is of strategic significance to China and Central Asia. This study aimed to effectively combine different data sources and classification systems to mitigate the lack of their interoperability regarding spatial distribution of land cover data. For this purpose, three types of land cover data were included. They were the visual interpretation of land use status in 2010 remote sensing monitoring data, GlobeLand30, and GlobCover2009. Four methods including category similarity analysis, category confusion analysis, confusion matrix analysis, and spatial consistency analysis were used to evaluate their accuracies and consistencies. We expect that this study would provide recommendations for the applicability of land cover data in the arid region of northwest China. The results showed that the three types of land cover data exhibited a good consistency for describing land cover categories in Xinjiang, with similarity higher than 0.9. Particularly, bare land identification demonstrated the highest consistency, followed by grassland, cultivated land, and forest. About 95% of the land area in Xinjiang showed a relatively high consistency, and the overall accuracy for land cover data ranged from 64.11% to 72.57%. Data from the group of visual interpretation/GlobCover2009 demonstrated the lowest accuracy, followed by the group of GlobeLand30/GlobCover2009. The group of visual interpretation data/GlobeLand30 had the highest accuracy, but it still had room for improvement. These results demonstrated that using the same satellite sensor plays an integral role in enhancing the accuracy of evaluation results. Moreover, classification systems, classification methods, spatial resolution, and satellite passage time used would also have a huge impact on the accuracy of evaluation results. In order to solve this problem more effectively, multi-source remote sensing data integration technology or deep learning will become more promising for accurately interpreting remote sensing image data in the near future, for further improving data accuracy in global land cover mapping and application fields. Depending on the distinctive landscape pattern of Xinjiang region, this research analyzed the accuracy of three different kinds of data for different land cover categories to provide reliable information which shall be proved to be useful in resource development, environment protection and sustainable development of Xinjiang. Additionally, it initiated a framework for providing basic data for China’s significant development strategy "the Belt and Road". Moreover, the results demonstrated the better performance of GlobeLand30 in accuracy assessment. As compared to other land cover data within the same category, the GlobeLand30 data is overwhelming in spatial resolution.
Keywords:
土地覆被是地球表面所有物质类型及其自然属性的综合体,其空间分布决定着生物与环境间的关系以及人类活动进程,影响着物质循环及能量和水热的动态平衡,甚至影响气候变化[1,2,3],因此获取不同时空尺度上的土地覆被信息,可为经济、社会、文化、生态、环境建设提供重要依据。自20世纪50年代至今,遥感技术获取不同传感器、分辨率的遥感影像能力大幅提高,为快速在大面积或区域尺度上采集、处理和深入分析土地覆被信息提供了重要手段[4]。
目前全球已有的土地覆被数据主要有6套[3,5-10],包括:① 美国马里兰大学推出的UMD Geocover;② 美国地质调查局推出的IGBP-DISCover;③ 美国波士顿大学推出的BU_MODIS;④ 欧盟联合研究中心推出的GLC2000;⑤ 欧空局推出的GlobCover2005和GlobCover2009;⑥ 中国国家基础地理信息中心推出的GlobeLand30系列产品。上述土地覆被数据在全球变化、水文循环、气候监测及可持续发展研究等方面起着至关重要的作用,但由于其不同遥感平台、分类方法及空间分辨率等因素的影响,在描述地表实际状况时存在着不同程度上的差异,从而在具体应用时,对不同地区的土地覆被数据开展精度检验显得尤为重要。
国内外已有研究人员对多种土地覆被数据进行了精度评价和算法分析。在精度评价方面,Brovelli等[11]根据数据的主要特征采用混淆矩阵的方法,将GlobeLand30数据与意大利地区的参考数据开展精度评价,结果表明数据精度高于80%;Pérez-Hoyos等[12]采用Bolean方法和基于LCCS分类系统的模糊集理论方法,评估了欧洲地区CORINE、GLC2000、MODIS LC和GlobCover土地覆被数据,结果表明CORINE与GLC2000具有最高的一致性;Ran等[13]使用1:10万的土地覆被图为参考,对IGBP-DISCover、UMD、MODIS和GLC2000四种土地覆被数据开展对比分析,研究表明GLC2000具有较高的准确性,MODIS数据在一致性方面表现较好;马京振等[14]使用空间统计法及误差矩阵,对比分析了河南地区GlobeLand 30、GlobCover 2009、MCD12Q1三种数据,得到GlobeLand30数据的总体精度和Kappa系数最高,MCD12Q1次之,GlobCover2009最低的结果,并认为GlobeLand30数据的混淆程度最低;戴昭鑫等[15]基于最大面积升尺度方法,研究了GLC2000、GlobCover2005、GlobCover2009、MODIS2000、GlobeLand30五种卫星遥感土地覆被数据在南美洲地区的一致性,结果表明5种数据的一致性在42.27%~87.59%之间,并得到林地类型的混淆程度最低,一致性最高的结果。在算法分析方面,Kuenzer等[16]对湄公河流域的UMD (1992-1993)、GLC2000、GlobCover2005、GlobCover2009、MODIS 2001-2011等陆地覆被数据进行比较,认为不同分类算法的影响比随时间迁移的数据影响更大,并得到混交植被类型特别是林地类型的混淆程度较大的结果;曹小敏等[17]基于面向对象与决策树相结合的土地覆被遥感制图方法,取Landsat TM影像为数据源,得到了尼泊尔全境2010年土地覆被产品(NepalCover-2010),其一级类与二级类的总体精度分别达到了94.83%和87.17%。
新疆地区地域辽阔,地势复杂,喜马拉雅造山运动使青藏高原隆起,形成了高海拔山脉与低海拔盆地并存,河流湖泊贯穿山地、盆地、丘陵的特殊地貌格局,造就了类别多样的土地覆被类型,是极宜开展土地覆被数据精度评价的典型区域。此外,新疆地区土地覆被的空间结构及变化对中国“一带一路”战略的实施及发展也举有十分重要的意义。近年来有关学者已经对部分地区的土地覆被数据进行了相关研究,但对西北干旱区的土地覆被数据研究较少,因此本文基于3种土地覆被数据,针对新疆地区进行精度评价分析,不仅直观评估3种土地覆被数据的精度,为其在新疆地区的适用性及适用区间提供了有效建议,同时为新疆地区的生态、环境及社会可持续发展等方面的研究提供可靠信息,以便更好地开展该地区生态、农业、文化及经济发展等重要工作。
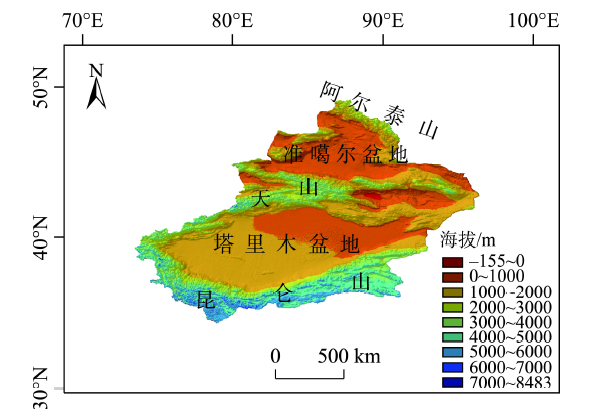
新疆维吾尔自治区位于中国西北边陲(34°25′N-48°10′N ,73°40′E-96°18′E),地处亚欧大陆中心,面积约1.6×10⁶ km2,整体地形地貌格局由3部分构成:北部为阿尔泰山和准噶尔盆地,中部横亘天山山脉,南部为广阔的塔里木盆地和昆仑山脉,地势起伏较大,形成了“三山夹两盆”的地貌格局(图1),并按其气候差异分为北疆和南疆。北疆气候呈现典型温带大陆性干旱气候,年平均气温-4~9 ℃,年降水量150~200 mm以上;南疆为暖温带大陆性干旱气候,年平均气温7~14 ℃,年降水量25~100 mm。
3种数据在分类系统、分类方法及空间分辨率上均不相同,且目视解译数据的准确性与解译人员的判读经验有直接关系。本文以2010年中国新疆地区的3种土地覆被数据为例,数据特点如下(表1):
表1 土地覆被数据参数及特点
Tab. 1 Parameters and features of land cover data
| 数据名称 | 制作单位 | 搭载卫星 | 传感器 | 时相 | 分类数量 | 分类方法 | 分辨率 |
|---|---|---|---|---|---|---|---|
| GlobeLand30 | NGCC | Landsat/HJ-1 | TM/ETM+ | 2000/2010 | 10 | POK分类方法 | 30 m |
| GlobCover2009 | ESA | Envisat | MERIS | 2005/2009 | 22 | 神经网络分类 | 300 m |
| 目视解译数据 | 中国科学院资源环境科学数据中心 | Landsat | TM/ETM+ | 2010 | 25 | 目视解译 | 1:10万 |
GlobeLand30拥有2000年和2010年2期产品,主要来自Landsat TM5、ETM+,及HJ-1多光谱影像,分辨率为30 m,由国家基础地理信息中心(The National Geomatics Center of China,NGCC)主持负责,联合测绘局、中科院、教育部、农业部、林业局等 18 家单位共同参与研制完成,是中国迈向全球学术领域的重要贡献之一。数据图像的80%于2009-2011年获取,共涵盖了南北纬80°间的陆地范围,拥有853幅图块,新疆占13幅[3]。
GlobCover共有两期产品,GlobCover2005和GlobCover2009,时相分别是2005年和2009年。其传感器MERIS中的光谱仪采用的是推扫式设计,可有效提高影像精度,减少形变,且两期产品分辨率同为300 m,并采用世界粮农组织(Food and Agriculture Organization of united nations,FAO)的LCCS分类系统和神经网络分类方法,将土地覆被类型划分为22类。
中国土地覆被现状遥感监测数据涵盖了全国陆地区域多时相1:10万比例尺栅格数据集,一共包含了1990年、1995年、2000年、2005年及2010年的全国土地覆被状况,数据主要来自各期Landsat TM和ETM+多光谱影像,通过人工目视解译方法,将全国土地覆被类型划分为6个一级类,25个二级类以及部分三级分类的土地覆被数据[18,19,20]。
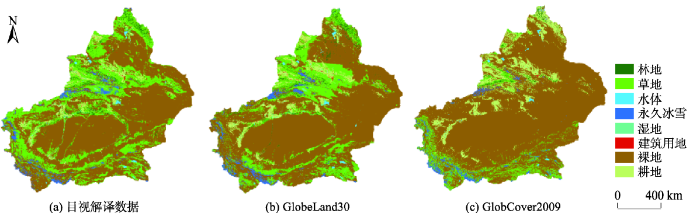
对3种土地覆被数据做精度评价之前,先进行预处理操作:数据剪裁及拼接、投影坐标系变换、升尺度转换、重新归并分类系统(重分类)及误差检验等步骤。① 利用ArcGIS平台提供的边界数据确定研究区范围,并对3种土地覆被数据进行拼接和剪裁。② 为降低由于不同坐标系和分辨率造成的误差,本文采用WGS-84坐标系和亚洲北部Albers等面积圆锥(Asia North Albers Equal Area Conic)投影(投影中央经线为90 °E,双标准纬线分别是36.30 °N、48 °N),将3种数据的分辨率同时升至300 m,并在300 m基础上进行后续操作,此过程能够最大限度地减少分配栅格时产生的误差。③ 设置分类系统,即在ArcGIS平台下进行重分类操作,将3种土地覆被数据中表示相同或分类较细化的土地覆被类型做合并处理,归并成统一全新的分类系统,全新的分类系统拥有8种土地覆被类型,依次为耕地、林地、草地、湿地、裸地、水体、永久冰雪、建设用地(图2,表2)。需要说明的是,对于目视解译数据,本研究将滩涂、滩地、沼泽地土地覆被类型合并为湿地类型,原因是3种地貌类型符合湿地的定义内容,即位于陆地和水域的交界带,有浅层积水或土壤过湿的土地,多生长有沼生或湿生植物。
图2 新疆地区土地覆被类型重分类情况
Fig. 2 Reclassification of land cover categories in Xinjiang
表2 土地覆被数据分类信息及归并关系
Tab. 2 Reclassified categories of land cover data and merger relation
| 归并分类 | GlobeLand30 | GlobCover2009 | 目视解译数据 |
|---|---|---|---|
| 1耕地 | 10耕地 | 11水浇地、14旱地、20耕地/植被镶嵌、30植被/耕地镶嵌 | 11水田、12旱地 |
| 2林地 | 20森林、 40灌木地 | 40常绿阔叶林/半落叶林、50郁闭落叶阔叶林、60开放落叶阔叶林、70郁闭常绿阔叶林、90开放落叶/常绿针叶林、100针阔混交林、110灌木/林地/草地镶嵌、130灌木 | 21有林地、22灌木地、23疏林地、24其他林地 |
| 3草地 | 30草地、 70苔原 | 120草地/林地/灌木镶嵌、140草地 | 31高覆盖度草地、32中覆盖度草地、33低覆盖度草地 |
| 4湿地 | 50湿地 | 160郁闭经常被淡水淹没的阔叶林、170郁闭经常被淡水-盐水淹没的半落叶或常绿阔叶林、180经常被淹没或者被土壤淡水、半咸水或者咸水浸湿的植被覆盖 | 45滩涂、46滩地、64沼泽地 |
| 5裸地 | 90裸地 | 150稀疏植被、200裸地 | 61沙地、62戈壁、63盐碱地、65裸土地、66裸岩石质地、67其它 |
| 6水体 | 60水体 | 210水体 | 41河渠、42湖泊、43水库坑塘、99海洋 |
| 7永久冰雪 | 100永久积雪 | 220永久冰雪 | 44永久性冰川雪地 |
| 8建设用地 | 80建设用地 | 190城市建设用地 | 51城镇用地、52农村居民点、53其他建设用地 |
类型相似分析能够定量分析2种土地覆被数据间相同土地覆被类型的相似程度,分析方法为:待新分类系统划分完成后,从影像数据的像元角度出发,分别计算各土地覆被类型的像元数(面积),以及该土地覆被类型像元数(面积)占所在数据总像元数(总面积)的百分比,然后对不同数据间相同土地覆被类型开展相关计算,针对计算结果评价相同土地覆被类型间的相似程度。
式中:
类型相似分析虽然能够定量表现数据间相同土地覆被类型的差异,却无法反映其在空间分布上的一致性状况,故在上述评价基础上,采用重分类后的图层叠加方法,能够表现不同土地覆被数据在同一土地覆被类型上的混淆程度,操作方法为:在ArcGIS平台下,利用ArcToolbox中的栅格计算器,重分类后将每种数据相同土地覆被类型图层叠加,得到的重叠部分像元数,就是这一土地覆被类型在空间分布上表现出一致性的像元数;将两种数据中不同土地覆被类型图层叠加,得到的重叠部分像元数,即是其它土地覆被类型在此类型上的混淆像元数,并制作混淆矩阵。
通过上述步骤得到的混淆矩阵是对土地覆被数据进行精度评价的重要方法。由混淆矩阵派生出来的精度评价方法一般有生产者精度(Produce Accuracy,PA)、使用者精度(User Accuracy,UA)及总体精度(Overall Accuracy,OA)。
式中:
类型相似分析和类型混淆分析是对3种土地覆被数据中任意两种数据在空间上的统计结果。为准确表达某一土地覆被类型的空间分异状况,本文采用空间一致性分析方法,具体操作为:利用栅格计算器,逐一叠加重分类后3种土地覆被数据中相同土地覆被类型图层,然后统计图层叠加情况。如计算裸地类型时,若3种土地覆被数据在某一点空间上同时显示为裸地,表示3种数据在此位置一致定义为裸地,为高度一致;若此位置只显示2种土地覆被数据,为中度一致;若只显示一种,为低度一致。
表3是3种土地覆被数据间的相关系数,图3表示3种数据在新疆地区各土地覆被类型的面积特征及对比。
表3 3种土地覆被数据间相关系数
Tab. 3 Correlation coefficient between three kindsof land cover data
| 数据名称 | GlobeLand30 | GlobCover2009 | 目视解译数据 |
|---|---|---|---|
| GlobeLand30 | 1.000 | 0.973 | 0.989 |
| GlobCover2009 | 0.973 | 1.000 | 0.969 |
| 目视解译数据 | 0.989 | 0.969 | 1.000 |
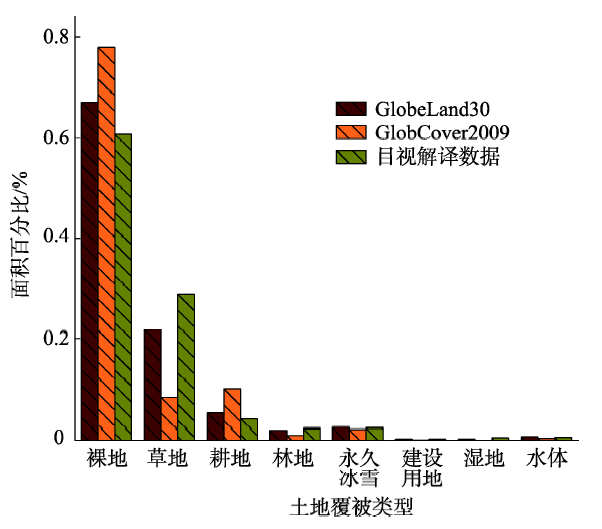
图3 2009-2010年新疆地区不同土地覆被类型面积对比
Fig. 3 Comparison of the area of different cover categories over Xinjiang during 2009-2010
总体来看,3种土地覆被数据在新疆地区的分类特征基本一致:裸地是新疆地区最主要土地覆被类型,且裸地、草地、耕地3种土地覆被类型面积总和占全疆90%以上,形成绝对优势,林地、永久冰雪、建设用地、湿地、水体占全疆面积不足10%(图2)。将数据进行整理分析得,GlobeLand30的土地分布以裸地(67.06%),草地(21.89%)、耕地(5.40%)为主,永久冰雪(2.45%)、林地(1.98%)依次递减;GlobCover2009数据中以裸地(78.00%)、耕地(10.06%)、草地(8.61%)3种类型为主,永久冰雪(2.03%)、林地(0.74%)依次递减,GlobCover2009认定的裸地与耕地面积在3种数据同类型中最高,其余类型面积均处同类型最低,其中湿地面积仅占0.0043%;在目视解译数据中,裸地(60.81%)、草地(28.96%)、耕地(4.21%)为优势类型,永久冰雪(2.36%)、林地(2.29%)依次递减。
GlobeLand30和目视解译数据的各土地覆被类型的面积比重上大致相同,与GlobCover2009相比,其在裸地、耕地和草地类型的面积上与前两者差别较大。3种数据在永久冰雪和水体类型方面的面积一致性均较高,永久冰雪的面积比重在2.00%~2.50%之间,水体的面积比重在0.40%~0.65%之间。土地覆被类型中设有“其他”一类,是由于3种数据在进行转换投影坐标、剪裁、拼接等过程中产生数据丢失或未分类的误差情况,未带入相关计算,最终结果不包含此项。
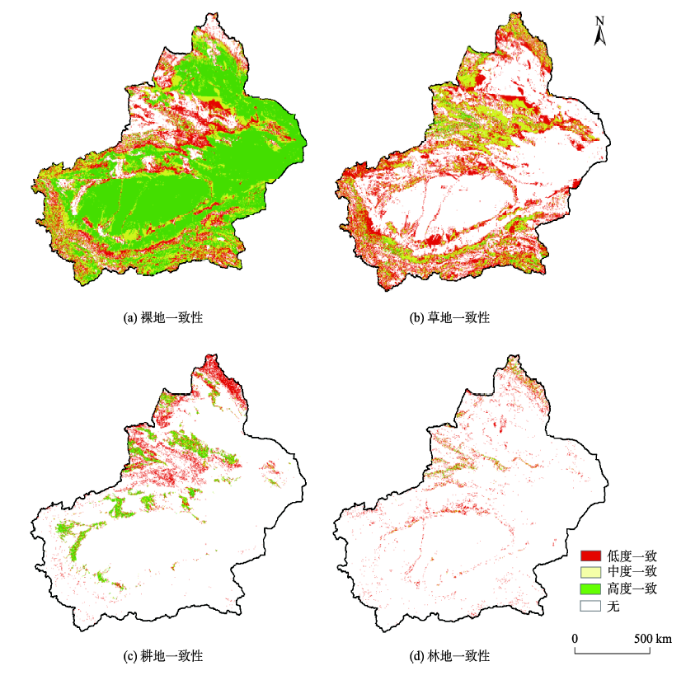
图4为3种数据中主要土地覆被类型的空间分布状况,绿色代表此类型在空间分布上高度一致区域,黄色代表中度一致区域,红色代表低度一致区域。
图4 3种数据主要土地覆被类型的空间一致性分布
Fig. 4 Spatial consistency analyses for main land cover categories
裸地(图4(a)):占据了新疆天山以南和以北的大部分地区。天山以北主要分布在准噶尔盆地及哈密北部,天山以南主要分布于塔里木盆地、吐哈盆地及帕米尔高原部分地区。可以看出,3种土地覆被数据对裸地的辨识程度最高,绝大部分区域有两种及两种以上数据同时显示为裸地,中高度一致的裸地类型面积占据全疆总面积的70.02%,并占到了全疆裸地总面积的81.40%。低度一致地区主要分布在天山中段及喀喇昆仑山山间地区。山脉周边的过渡区域是裸地类型出现混淆的高频区域。
草地(图4(b)):主要分布在乌苏市北部、伊犁河谷及喀喇昆仑山山间地区等,其高度一致区域面积较小,占全疆草地类型总面积的4.5%,中高度一致区域面积占全疆草地类型总面积的41.09%。低度一致区域主要分布在地形较为复杂的山地、盆地间过渡带。
耕地(图4(c)):普遍分布在阿尔泰山地区、天山地区和塔里木盆地周边地区,且高度一致区域较为明显。中高度一致区域面积占耕地总面积的27.13%,主要位于天山北部地区和塔里木盆地的西北边缘地区。
林地(图4(d)):天山北坡、伊犁河谷及阿尔泰山地区林地的辨识度较高,其他大多地区仅有一种数据显示为林地。
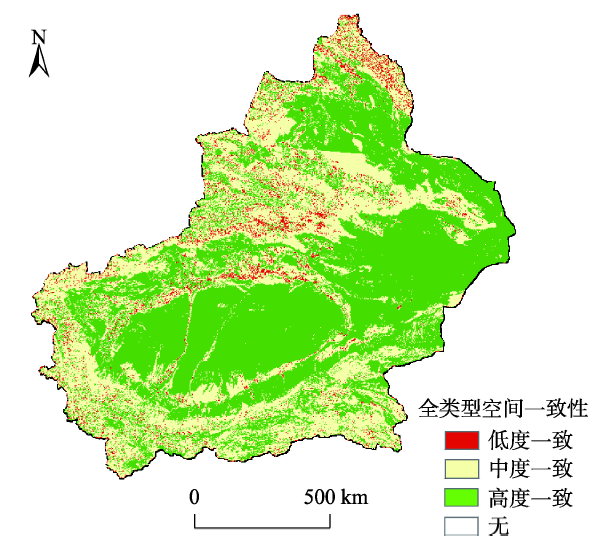
基于各土地覆被类型的空间一致性分析,整合后得到3种土地覆被数据全类型空间一致性图谱,如图5所示。从整个新疆地区上可以看出,准噶尔盆地、吐哈盆地、塔里木盆地及部分山间地区的一致性最高,阿尔泰山部分地区、天山南缘及塔里木北缘地区的空间一致性较低。
图5 3种数据全类型空间一致性分析谱图
Fig. 5 Full-category spatial consistency analysis map among three kinds of data
数据表明,3种土地覆被数据的完全一致区域(3种数据显示相同)占新疆地区总面积的56.35%,中度一致区域(2种数据显示相同)占新 疆地区总面积的39.10%,低度一致区域(只显示一种数据)占新疆地区总面积的4.52%,完全不一致区域(无数据显示)占新疆总面积的比例为0.03%。其中,高度一致区域的土地覆被类型主要为裸地和耕地类型,普遍分布在准噶尔盆地、吐哈盆地、塔里木盆地及部分山间地区。中度一致区域的覆被类型主要裸地和草地,主要分布在山间及山脉与盆地的过渡区域。低度一致区域的混淆类型较多,主要集中在阿尔泰山、天山南部及塔里木北缘地区。如果以60%的可信度(3种数据中有两种及以上同时指示为相同土地覆被类型)考虑,根据统计可知,新疆地区95%左右的土地具有很好的可信度。
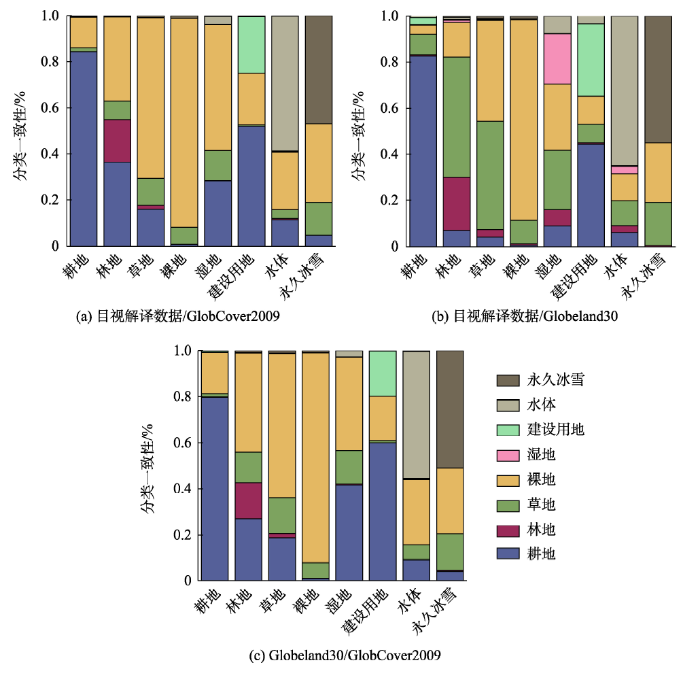
图6为3种数据各土地覆被类型的混淆情况。可以看出,在新疆地区,裸地和耕地两种类型的混淆程度最低,具有很高的辨识度,原因是裸地占新疆地区大部分面积,且随时间的可变性低。在每种组合中,水体和永久冰雪2种类型的一致程度较高,普遍大于或接近50%,原因是这2种类型有着较易识别的光谱特征,且分布较为连续。
图6 新疆地区土地覆被类型混淆分布情况
Fig. 6 Confusion distribution of land cover categories in Xinjiang
其它方面,每种组合中的其它类型都与裸地和耕地2种土地覆被类型有着不同程度的混淆,其中在草地、林地、湿地、建设用地4种类型中较为明显。另外,林地类型中出现了与草地类型的大量混淆,原因可能是林地类型中的灌丛与草地类型的光谱特性较为相似,故此高光谱遥感的引入或许可以使得地物光谱混淆的现象得到极大控制。其次,“西部大开发”战略使得新疆地区建设速度加快,城乡与工矿建设面积不断扩大,建设用地类型逐渐取代周边耕地、裸地等土地覆被类型,也是建设用地类型发生混淆的重要原因。在所有类型中,湿地的混淆程度最高,原因可能是3种数据在不同的分类系统、分类方法、空间分辨率及卫星过境时间等因素导致。
表4是选取3种土地覆被数据中的任意2种制作混淆矩阵后得到的精度评价结果。可以看出,目视解译数据/GlobCover2009组合的一致性最低(OA=64.18%),目视解译数据/GlobeLand 30组合的一致性最高(OA=72.57%)。从土地覆被类型上看,3种组合在裸地和耕地类型上的生产者精度差异较小,且都处于较高水平。在使用者精度方面,目视解译数据/GlobeLand30组合更胜一筹。对于林地、建设用地、水体和永久冰雪四种土地覆被类型而言,其生产者精度都在目视解译数据/GlobeLand30组合中表现出了最高水平;在使用者精度方面,林地和建设用地的最高值出现在了目视解译数据/GlobCover 2009组合中,水体和永久冰雪的最高值出现在了GlobeLand30/GlobCover2009组合中。其余2种土地覆被类型,草地和湿地,其生产者精度和使用者精度的最高值都出现在了目视解译数据/GlobeLand30组合中。
表4 新疆地区土地覆被数据的精度对比分析及相关系数
Tab. 4 Comparative analysis and correlation coefficient of land cover data in Xinjiang (%)
| 参考 待评价 | 目视解译数据 | GlobeLand30 | ||||||
|---|---|---|---|---|---|---|---|---|
| GlobCover2009 | GlobeLand30 | GlobCover2009 | ||||||
| PA | UA | PA | UA | PA | UA | |||
| 耕地 | 84.39 | 35.30 | 82.74 | 64.38 | 79.84 | 42.89 | ||
| 林地 | 18.44 | 44.73 | 23.22 | 27.02 | 15.66 | 41.84 | ||
| 草地 | 11.86 | 40.94 | 47.17 | 62.39 | 15.60 | 39.68 | ||
| 裸地 | 90.75 | 70.73 | 87.19 | 79.05 | 91.64 | 78.79 | ||
| 湿地 | 0.09 | 10.00 | 21.79 | 37.37 | 0.04 | 2.95 | ||
| 建设用地 | 24.62 | 64.62 | 31.42 | 32.35 | 19.64 | 50.08 | ||
| 水体 | 58.59 | 75.94 | 64.96 | 57.29 | 55.13 | 81.49 | ||
| 永久冰雪 | 46.90 | 55.06 | 55.00 | 53.55 | 50.97 | 61.16 | ||
| OA | 64.11 | 72.57 | 71.15 | |||||
深入研究后发现,目视解译数据/GlobeLand30组合在3种组合中表现出最高水平的大部分原因是目视解译数据与GlobeLand30数据都采用了Landsat卫星传感器。另外,目视解译数据/GlobeLand30组合在一致性和精度表现上仍有待提高,原因除了GlobeLand30数据卫星传感器采用了HJ-1卫星以外,其在分类系统、分类方法、空间分辨率和卫星过境时间上的不同也对结果产生了巨大影响。
本文基于新疆地区,结合2010年目视解译土地利用现状遥感监测数据、GlobeLand30和GlobCover2009 3种土地覆被数据,采用类型相似分析、类型混淆分析、混淆矩阵分析、空间一致性分析4种方法,得到如下结论:
(1)3种土地覆被数据对新疆地区土地覆被类型构成基本一致,即裸地类型占绝对优势,与草地、耕地共同组成新疆地区主要覆被类型。GlobCover2009在3种主要覆被类型的面积分布上与其他2种数据间存在较大差异。3种数据中任意两种组合的相关系数均在0.969~0.989之间,其中目视解译数据/GlobeLand30组合的一致性最高。
(2)3种土地覆被数据在准噶尔盆地、吐哈盆地、塔里木盆地的中心地带拥有最高水平的一致性,在天山北坡地区和喀喇昆仑山山区拥有中等水平的一致性,在阿尔泰山山区、天山南部与塔里木盆地过渡区域等山间地区及过渡带的一致性水平最低。在土地覆被类型混淆程度方面,3种土地覆被数据对裸地类型的辨别程度最高,其次是耕地,其余各土地覆被类型均存在不同程度混淆,其中湿地类型的混淆程度最高。在同土地覆被类型的比较中,目视解译数据/GlobeLand30组合的生产者精度及使用者精度大多处于较高水平。
(3)对3种土地覆被数据的任意两种组合进行混淆矩阵和精度评价分析后发现,3种组合的总体精度在64.11%~72.57%,可以看出,目视解译数据/GlobeLand30组合表现的精度评价结果及一致性最高,目视解译数据/GlobCover2009组合体现的精度评价结果及一致性最低。研究后发现,采用相近卫星传感器是提升精度评价结果及一致性的重要原因之一,不同分类系统、分类方法、空间分辨率及卫星过境时间也是影响精度评价结果的重要原因之一。
本研究基于新疆地区对3种土地覆被数据开展精度评价分析,预处理后使用升尺度转换法将3种不同土地覆被数据整合至同一分辨率;创建新的分类系统后,统一归并划分成新的土地覆被类型,使精度评价分析始于同一基准。通过类型混淆分析和空间一致性分析等方法,本研究从概率统计上得到了新疆地区更精确的研究依据,也为土地覆被数据在新疆地区的适用性和推广提供了基础的数据保证。针对不同数据间分类系统及分类方法的不兼容问题,在如今多源土地覆被遥感数据并存的大背景下,利用多源土地覆被遥感数据的融合技术提高数据精度,或利用深度学习对影像资料开展解译和判读工作,可能是未来全球土地覆被制图及应用领域的主要发展趋势。
The authors have declared that no competing interests exist.
| [1] |
Assessing the impacts of climate and land use and land cover change on the freshwater availability in the Brahmaputra River basin [J].https://doi.org/10.1016/j.ejrh.2014.09.003 URL [本文引用: 1] 摘要
Study Region: Brahmaputra River basin in South Asia. Study Focus: The Soil and Water Assessment Tool was used to evaluate sensitivities and patterns in freshwater availability due to projected climate and land use changes in the Brahmaputra basin. The daily observed discharge at Bahadurabad station in Bangladesh was used to calibrate and validate the model and analyze uncertainties with a sequential uncertainty fitting algorithm. The sensitivities and impacts of projected climate and land use changes on basin hydrological components were simulated for the A1B and A2 scenarios and analyzed relative to a baseline scenario of 1988–2004. New hydrological insights for the region: Basin average annual ET was found to be sensitive to changes in CO2 concentration and temperature, while total water yield, streamflow, and groundwater recharge were sensitive to changes in precipitation. The basin hydrological components were predicted to increase with seasonal variability in response to climate and land use change scenarios. Strong increasing trends were predicted for total water yield, streamflow, and groundwater recharge, indicating exacerbation of flooding potential during August–October, but strong decreasing trends were predicted, indicating exacerbation of drought potential during May–July of the 21st century. The model has potential to facilitate strategic decision making through scenario generation integrating climate change adaptation and hazard mitigation policies to ensure optimized allocation of water resources under a variable and changing climate.
|
| [2] |
Land-cover change dynamics and insights into ecosystem services in European stream riparian zones [J].https://doi.org/10.1016/j.ecohyd.2014.01.002 [本文引用: 1] 摘要
Riparian zones, transitional environments between terrestrial and freshwater ecosystems, have been historically threatened in Europe by land reclamation and exploitation of their natural resources. These fragile environments deliver a large number of ecological and societal services, while simultaneously playing a key role in the maintenance of biodiversity in fragmented landscapes. At large scales, one of the clearest and most informative indicators of alteration of state and characteristics of ecological systems is land-cover change. A newly available European riparian zone distribution dataset and continental land-cover change information allowed us to obtain an unprecedented continental overview of riparian land conversion and associated drivers, as well as a broad indication of their loss of capacity to provide ecosystem services. The analysis shows that only 1.8% of riparian zones experienced land-cover changes in the period 2000 2006. The majority of riparian changes involved forest loss and forest regrowth due to forestry activities and, to a lesser extent, to fires. Approximately 9% of land-cover changes involved conversion to artificial and agricultural surface, with trajectories largely affecting their ecological integrity. Using land-cover proxy-based indicators we show that the loss of riparian zones capacity to support ecological integrity and ecosystem services was overall significantly higher than the proportion of converted surface. The methodological approach can be used to support the assessment of environmental policy targets, and for regional planning and management of riparian zones.
|
| [3] |
全球30m地表覆盖遥感数据产品-GlobeLand30 [J].30-Meter Global land cover data product- GlobeLand30 [J]. |
| [4] |
土地利用/土地覆盖遥感变化检测方法新进展 [J].https://doi.org/10.3969/j.issn.1000-3177.2006.03.024 URL [本文引用: 1] 摘要
土地利用/土地覆盖变化检测是资源环境研究中的一个重要方面。准确、及时的变化信息为人类资源环境的生产和管理提供了决策支持。遥感技术具有实时、快速、覆盖范围广、多光谱、周期性等特点,给土地利用/土地覆盖变化检测提供了理想的数据基础。人类社会的发展对土地利用/土地覆盖变化检测的精度与效率不断提出新的要求,这也使得一些新技术、新方法引入到变化检测中。这些新技术新方法提高了土地利用/土地覆盖变化检测的精度,但在效率方面有待进一步研究。
New progress in land use/land cover change detection by remote sensing [J].https://doi.org/10.3969/j.issn.1000-3177.2006.03.024 URL [本文引用: 1] 摘要
土地利用/土地覆盖变化检测是资源环境研究中的一个重要方面。准确、及时的变化信息为人类资源环境的生产和管理提供了决策支持。遥感技术具有实时、快速、覆盖范围广、多光谱、周期性等特点,给土地利用/土地覆盖变化检测提供了理想的数据基础。人类社会的发展对土地利用/土地覆盖变化检测的精度与效率不断提出新的要求,这也使得一些新技术、新方法引入到变化检测中。这些新技术新方法提高了土地利用/土地覆盖变化检测的精度,但在效率方面有待进一步研究。
|
| [5] |
Global land cover classification at 1 km spatial resolution using a classification tree approach [J]. |
| [6] |
Development of a global land cover characteristics database and IGBP DISCover from 1 km AVHRR data [J].https://doi.org/10.1080/014311600210191 URL 摘要
Researchers from the U.S. Geological Survey, University of Nebraska-Lincoln and the European Commission''s Joint Research Centre, Ispra, Italy produced a 1 km resolution global land cover characteristics database for use in a wide range of continental-to global-scale environmental studies. This database provides a unique view of the broad patterns of the biogeographical and ecoclimatic diversity of the global land surface, and presents a detailed interpretation of the extent of human development. The project was carried out as an International Geosphere-Biosphere Programme, Data and Information Systems (IGBP-DIS) initiative. The IGBP DISCover global land cover product is an integral component of the global land cover database. DISCover includes 17 general land cover classes defined to meet the needs of IGBP core science projects. A formal accuracy assessment of the DISCover data layer will be completed in 1998. The 1 km global land cover database was developed through a continent-by-continent unsupervised classification of 1 km monthly Advanced Very High Resolution Radiometer (AVHRR) Normalized Difference Vegetation Index (NDVI) composites covering 1992-1993. Extensive post-classification stratification was necessary to resolve spectral/temporal confusion between disparate land cover types. The complete global database consists of 961 seasonal land cover regions that capture patterns of land cover, seasonality and relative primary productivity. The seasonal land cover regions were aggregated to produce seven separate land cover data sets used for global environmental modelling and assessment. The data sets include IGBP DISCover, U.S. Geological Survey Anderson System, Simple Biosphere Model, Simple Biosphere Model 2, Biosphere-Atmosphere Transfer Scheme, Olson Ecosystems and Running Global Remote Sensing Land Cover. The database also includes all digital sources that were used in the classification. The complete database can be sourced from the website: http://edcwww.cr.usgs.gov/landdaac/glcc/glcc.html.
|
| [7] |
Global land cover mapping from MODIS: Algorithms and early results [J].https://doi.org/10.1016/S0034-4257(02)00078-0 URL 摘要
Until recently, advanced very high-resolution radiometer (AVHRR) observations were the only viable source of data for global land cover mapping. While many useful insights have been gained from analyses based on AVHRR data, the availability of moderate resolution imaging spectroradiometer (MODIS) data with greatly improved spectral, spatial, geometric, and radiometric attributes provides significant new opportunities and challenges for remote sensing-based land cover mapping research. In this paper, we describe the algorithms and databases being used to produce the MODIS global land cover product. This product provides maps of global land cover at 1-km spatial resolution using several classification systems, principally that of the IGBP. To generate these maps, a supervised classification methodology is used that exploits a global database of training sites interpreted from high-resolution imagery in association with ancillary data. In addition to the IGBP class at each pixel, the MODIS land cover product provides several other parameters including estimates for the classification confidence associated with the IGBP label, a prediction for the most likely alternative class, and class labels for several other classification schemes that are used by the global modeling community. Initial results based on 5 months of MODIS data are encouraging. At global scales, the distribution of vegetation and land cover types is qualitatively realistic. At regional scales, comparisons among heritage AVHRR products, Landsat TM data, and results from MODIS show that the algorithm is performing well. As a longer time series of data is added to the processing stream and the representation of global land cover in the site database is refined, the quality of the MODIS land cover product will improve accordingly.
|
| [8] |
GLC2000: A new approach to global land cover mapping from Earth observation data [J].https://doi.org/10.1080/01431160412331291297 URL 摘要
A new global land cover database for the year 2000 (GLC2000) has been produced by an international partnership of 30 research groups coordinated by the European Commission's Joint Research Centre. The database contains two levels of land cover information—detailed, regionally optimized land cover legends for each continent and a less thematically detailed global legend that harmonizes regional legends into one consistent product. The land cover maps are all based on daily data from the VEGETATION sensor on‐board SPOT 4, though mapping of some regions involved use of data from other Earth observing sensors to resolve specific issues. Detailed legend definition, image classification and map quality assurance were carried out region by region. The global product was made through aggregation of these. The database is designed to serve users from science programmes, policy makers, environmental convention secretariats, non‐governmental organizations and development‐aid projects. The regional and global data are available free of charge for all non‐commercial applications from http://www.gvm.jrc.it/glc2000.
|
| [9] |
Accuracy assessment of a 300 m global land cover map: The GlobCover experience [J].https://doi.org/10.1108/03074801111136275 URL 摘要
Abstract The GlobCover project supported by ESA has developed an operational service dedicated to the generation of global land cover maps through an automated classification of MERIS FRS time series. This paper reports the independent accuracy assessment of the global GlobCover product as the first global exercise implemented according to the CEOS Land Product Validation group recommendations. Based on a network of 16 international experts and on-line tools, a unique, globally distributed reference data set was collected in a standardized manner and used to derive mapping accuracy figures. The overall accuracy, weighted by the area proportions of the various land cover classes, is 73 % based on a set of 3167 samples. These results are discussed with regards to the previous experiences.
|
| [10] |
China: Open access to earth land-cover map [J].https://doi.org/10.1038/514434c URL PMID: 25341776 [本文引用: 1] 摘要
China : Open access to Earth land-cover map
|
| [11] |
The first comprehensive accuracy assessment of GlobeLand30 at a national level: Methodology and results [J].https://doi.org/10.3390/rs70404191 URL [本文引用: 1] |
| [12] |
Conventional and fuzzy comparisons of large scale land cover products: Application to Corine, GLC2000, MODIS and GlobCover in Europe [J].https://doi.org/10.1016/j.isprsjprs.2012.09.006 URL [本文引用: 1] 摘要
One of the major drawbacks of land cover products is the lack of interoperability among them. Since their development was driven by different national or international initiatives, they were developed for different purposes and hold diverse technical characteristics. Thus, comparison among products and quality monitoring is necessary in assessing their usefulness. This paper provides a methodology to compare global land cover maps that allows for differences in legend definitions among products. Two different approaches were considered for map comparison, a Boolean approach and a new methodology based on fuzzy set theory in which the Land Cover Classification System (LCCS) acted as a general bridging system. The fuzzy approach let us reconcile legends in terms of a set of nine selected attributes. The methodology is illustrated over Europe using four different land cover products: CORINE, GLC2000, MODIS land cover (MODISLC) and GlobCover. Overall accuracies between datasets based on a generalized nomenclature ranged from 35% (GlobCover ODISLC) to 57% (CORINE LC2000). A further assessment based on a flexible Boolean comparison allowed us to minimize part of the uncertainty introduced by ambiguity of legends, resulting in an overall increase of agreement of around 10% in absolute terms. Reduction of positional errors produced an agreement increase of around 5%. The fuzzy approach allowed us to examine certain criteria used in classification systems to better understand the causes of discrepancies among datasets and express them in terms of relevant land attributes, irrespective of class names. This method served to highlight the consistency of the land cover maps under consideration, especially for datasets that showed higher divergences. In particular, it allows the identification of areas that are very close in land attributes, even when a Boolean comparison shows them as different.
|
| [13] |
Evaluation of four remote sensing based land cover products over China [J].https://doi.org/10.1080/01431160902893451 URL [本文引用: 1] 摘要
Precise global/regional land cover mapping is of fundamental importance in studies of land surface processes and modelling. Quantitative assessments of the map quality and classification accuracy for existing land cover maps will help to improve accuracy in future land cover mapping. We compare and evaluate four land cover datasets over China. The datasets include the Version 2 global land cover dataset of IGBP, MODIS land cover map 2001, a global land cover map produced by the University of Maryland, and the land cover map produced by the global land cover for the year 2000 (GLC 2000) project coordinated by the Global Vegetation Monitoring Unit of the European Commission Joint Research Centre. The four maps used different classification systems, which made the comparison difficult. So we first aggregated these maps by reclassifying them using a unified legend system. A large-scale, i.e. 1:100 000 land cover map of China was used as the reference data to validate the four maps. The results show that the GLC2000 land cover map represents the highest accuracy. However, it has obvious local labelling errors and a zero labelling accuracy for the wetland type. The MODIS land cover map ranks second for type area consistency and third for sub-fraction overall accuracy compared with reference data, which may be affected by the local labelling error. The IGBP land cover map has good labelling accuracy, although it has a local labelling error and third consistency for type area. The labelling accuracy and type area consistency for the reference data of UMd land cover map is low. We conclude that the accuracies of all the datasets cannot meet the requirements of land surface modelling. For the reference data, i.e. the 1:100 000 land cover map, the classification system needs to be transferred to a well recognized one that has been used commonly in land surface modelling. In addition, we propose an information fusion strategy to produce a more accurate land cover map of China whose classification system should be compatible with the well-accepted classification system used in land surface modelling.
|
| [14] |
河南省GlobeLand30数据精度评价及对比分析 [J].
全球地表覆盖数据在气候变化研究、地理国情监测、生态环境保护等方面发挥着重要作用,2014年中国国家基础地理信息中心推出了全球最高30 m分辨率的地表覆盖遥感制图数据产品Globe Land30。本文以2010年1:10万中国土地利用数据为参考,采用空间统计、面积一致性以及误差矩阵等分析方法,对河南省Globe Land30、Glob Cover2009、MCD12Q1数据进行精度评价和对比分析研究,结果表明:(1)3种地表覆盖数据对河南省土地构成的描述基本一致,即以耕地、林地为主,草地、水体和人造地表为辅,但分类土地面积存在大小不同的差异;(2)Globe Land30的总体精度和Kappa系数最高,MCD12Q1次之,GlobCover2009最低。3种数据中耕地和林地的精度均较高,草地的精度较差,Globe Land30中水体和人造地表的生产者精度远高于其他2种数据,使用者精度相差不大;(3)地表覆盖数据与参考数据在空间上存在类型混淆情况,混淆主要发生于林地、草地、水体、人造地表与耕地之间,Globe Land30的混淆程度要低于其他2种数据。
Accuracy assessment and comparative analysis of GlobeLand30 dataset in Henan province [J].
全球地表覆盖数据在气候变化研究、地理国情监测、生态环境保护等方面发挥着重要作用,2014年中国国家基础地理信息中心推出了全球最高30 m分辨率的地表覆盖遥感制图数据产品Globe Land30。本文以2010年1:10万中国土地利用数据为参考,采用空间统计、面积一致性以及误差矩阵等分析方法,对河南省Globe Land30、Glob Cover2009、MCD12Q1数据进行精度评价和对比分析研究,结果表明:(1)3种地表覆盖数据对河南省土地构成的描述基本一致,即以耕地、林地为主,草地、水体和人造地表为辅,但分类土地面积存在大小不同的差异;(2)Globe Land30的总体精度和Kappa系数最高,MCD12Q1次之,GlobCover2009最低。3种数据中耕地和林地的精度均较高,草地的精度较差,Globe Land30中水体和人造地表的生产者精度远高于其他2种数据,使用者精度相差不大;(3)地表覆盖数据与参考数据在空间上存在类型混淆情况,混淆主要发生于林地、草地、水体、人造地表与耕地之间,Globe Land30的混淆程度要低于其他2种数据。
|
| [15] |
多源卫星遥感土地覆被产品在南美洲的一致性分析 [J].https://doi.org/10.3969/j.issn.1000-3177.2017.02.021 URL [本文引用: 1] 摘要
针对不同卫星遥感产品在不同区域缺乏一致性基准的问题,提出类型构成相似性、类别混淆程度、空间一致性及参考程度等4种方法,对比分析不同土地覆被产品间的一致性。鉴于南美洲区域土地覆被空间结构和变化对全球变化研究具有重要意义,利用上述4种方法研究了GLOBCOVER2005、GLOBCOVER2009、GLC2000、MODIS2000、GLOBELAND30-2010等5种全球卫星土地覆被产品在南美洲地区的一致性。结果表明,5种产品对于南美洲土地类型的构成刻画基本一致,且对林地识别的一致性最高;南美洲有近60%的土地具有较高的一致性;5种产品两两比较时,参考精度大致在42.27-87.59%之间,GLOBCOVER2009/GLOBCOVER2005组合的参考精度最高,反映出土地覆被动态变化所引起的误差远小于不同制作机构、不同数据源、不同判读方法所带来的制作误差。
Agreement analysis of multi-source land cover products derived from remote sensing in South America [J].https://doi.org/10.3969/j.issn.1000-3177.2017.02.021 URL [本文引用: 1] 摘要
针对不同卫星遥感产品在不同区域缺乏一致性基准的问题,提出类型构成相似性、类别混淆程度、空间一致性及参考程度等4种方法,对比分析不同土地覆被产品间的一致性。鉴于南美洲区域土地覆被空间结构和变化对全球变化研究具有重要意义,利用上述4种方法研究了GLOBCOVER2005、GLOBCOVER2009、GLC2000、MODIS2000、GLOBELAND30-2010等5种全球卫星土地覆被产品在南美洲地区的一致性。结果表明,5种产品对于南美洲土地类型的构成刻画基本一致,且对林地识别的一致性最高;南美洲有近60%的土地具有较高的一致性;5种产品两两比较时,参考精度大致在42.27-87.59%之间,GLOBCOVER2009/GLOBCOVER2005组合的参考精度最高,反映出土地覆被动态变化所引起的误差远小于不同制作机构、不同数据源、不同判读方法所带来的制作误差。
|
| [16] |
Comparing global land-cover products-implications for geoscience applications: An investigation for the trans-boundary Mekong basin [J].https://doi.org/10.1080/01431161.2014.890305 URL [本文引用: 1] 摘要
In this article we present the results of a comparison of six globally available land-cover products for the Mekong Basin – an area that spans 795,00002km2 and comprises parts of six riparian countries: China, Myanmar, Thailand, Laos, Cambodia, and Vietnam. The basin covers most climatic zones: from high-altitude, snow-covered mountainous regions in the north, to subtropical and tropical rainforest areas and agricultural land further south. The geopolitically important region not only is home to over 72,000,000 inhabitants, but also is a centre of attention of several environmental modelling experts, trying to assess future hydrologic dynamics, climate variability, as well probable land-use developments in the area. We compare land-cover products of the University of Maryland, UMD 1992–1993, the GLC 2000 product, the GlobCover products of 2004–2006 and 2009, as well as the MODIS-derived land-cover products of 2001 and 2009. For harmonization of individual legends, the Land Cover Classification System, LCCS, has been employed. However, even after harmonization, cross-tabulation among the products reveals extreme differences, where the impact of differing classification algorithms weighs higher than the impact of temporal coincidence of products. Especially, differences within mixed-vegetation classes are large, strongly impacting the overall assessment of forested land, other vegetated land, and even cultivated land in the Mekong Basin. The findings presented here are of high relevance for the modelling community as well as Mekong-related environmental studies, which should consider global remote-sensing-derived products with caution and solid background knowledge.
|
| [17] |
尼泊尔土地覆被遥感制图及其空间格局分析 [J].https://doi.org/10.3724/SP.J.1047.2016.01384 URL Magsci [本文引用: 1] 摘要
<p>尼泊尔作为兴都库什-喜马拉雅区域的重要组成部分,是一个从平原到山地再到高原的典型过渡地带,具有多样且复杂的土地覆被类型。开展尼泊尔国家尺度的土地覆被研究,对该国的国土资源管理、生态环境保护具有重要的科学和实践意义,同时也能为中国倡导的“一带一路”国际区域经济合作战略提供基础数据保障。本文选用Landsat TM影像为数据源,基于面向对象与决策树相结合的土地覆被遥感制图方法,生产了尼泊尔全境2010年土地覆被产品(NepalCover-2010),该产品包括8个一级类和32个二级类。同时,本文基于Google Earth高分辨率影像获取验证样本开展了NepalCover-2010产品的精度验证工作,并进一步分析了该国土地覆被类型的数量结构特征和空间格局特征与地形、气象要素间的关系。研究结果表明:① NepalCover-2010产品一级类总体分类精度达94.83%,Kappa系数为0.94;二级类的总体分类精度达87.17%,Kappa系数为0.85,能够准确地反映尼泊尔土地覆被类型的空间分布格局,是同类土地覆被产品中精度最好的。② 林地是尼泊尔最主要的土地覆被类型,其面积约占尼泊尔国土面积的41%。耕地次之,其面积占比约为25%,其中水田和旱地的面积分布比例约为2:3。③ 地形和气象要素对尼泊尔的土地覆被类型空间分布格局具有显著影响,自南向北随着地势的抬升,各土地覆被类型出现顺序表现出水田、常绿阔叶林、旱地、常绿阔叶灌木林、常绿针叶林、草原、稀疏植被和冰川/永久积雪的垂直地带性特征。</p>
Land Cover mapping and spatial pattern analysis with remote sensing in Nepal [J].https://doi.org/10.3724/SP.J.1047.2016.01384 URL Magsci [本文引用: 1] 摘要
<p>尼泊尔作为兴都库什-喜马拉雅区域的重要组成部分,是一个从平原到山地再到高原的典型过渡地带,具有多样且复杂的土地覆被类型。开展尼泊尔国家尺度的土地覆被研究,对该国的国土资源管理、生态环境保护具有重要的科学和实践意义,同时也能为中国倡导的“一带一路”国际区域经济合作战略提供基础数据保障。本文选用Landsat TM影像为数据源,基于面向对象与决策树相结合的土地覆被遥感制图方法,生产了尼泊尔全境2010年土地覆被产品(NepalCover-2010),该产品包括8个一级类和32个二级类。同时,本文基于Google Earth高分辨率影像获取验证样本开展了NepalCover-2010产品的精度验证工作,并进一步分析了该国土地覆被类型的数量结构特征和空间格局特征与地形、气象要素间的关系。研究结果表明:① NepalCover-2010产品一级类总体分类精度达94.83%,Kappa系数为0.94;二级类的总体分类精度达87.17%,Kappa系数为0.85,能够准确地反映尼泊尔土地覆被类型的空间分布格局,是同类土地覆被产品中精度最好的。② 林地是尼泊尔最主要的土地覆被类型,其面积约占尼泊尔国土面积的41%。耕地次之,其面积占比约为25%,其中水田和旱地的面积分布比例约为2:3。③ 地形和气象要素对尼泊尔的土地覆被类型空间分布格局具有显著影响,自南向北随着地势的抬升,各土地覆被类型出现顺序表现出水田、常绿阔叶林、旱地、常绿阔叶灌木林、常绿针叶林、草原、稀疏植被和冰川/永久积雪的垂直地带性特征。</p>
|
| [18] |
21世纪初中国土地利用变化的空间格局与驱动力分析 [J].https://doi.org/10.3321/j.issn:0375-5444.2009.12.001 URL [本文引用: 1] 摘要
在全球环境变化研究中,以土地利用与土地覆盖动态为核心的人类-环境耦合系统研究逐渐成为土地变化科学(LCS)研究的新动向。基于覆盖中国21世纪初5年间隔的遥感卫星数据获取的1km网格土地利用变化空间信息,依据近5年土地利用变化区域分异的显著特征,以及自然地理、经济发展与国家宏观政策因素综合考虑,设计针对21世纪初5年新的中国土地利用动态区划图,揭示土地利用变化的空间格局与驱动因素。总体上,21世纪初5年中国处于土地利用快速变化期,黄淮海平原、东南沿海地区与四川盆地城乡建设用地显著扩张,占用大规模优质农田,导致南方水田面积明显减少;西北绿洲农业发展与东北地区开垦导致北方旱地面积略有增加;受西部开发"生态退耕"政策的影响中西部地区林地面积显著增加,国家退耕还林还草政策成效明显,对区域土地覆盖状况的改善产生积极的影响;这一时段国土开发与区域发展战略的实施,包括"西部大开发"、"东北振兴"等国家重大政策,加之快速的经济发展是该阶段土地利用变化格局形成的主要驱动因素。
Spatial patterns and driving forces of land use change in China in the early 21st century [J].https://doi.org/10.3321/j.issn:0375-5444.2009.12.001 URL [本文引用: 1] 摘要
在全球环境变化研究中,以土地利用与土地覆盖动态为核心的人类-环境耦合系统研究逐渐成为土地变化科学(LCS)研究的新动向。基于覆盖中国21世纪初5年间隔的遥感卫星数据获取的1km网格土地利用变化空间信息,依据近5年土地利用变化区域分异的显著特征,以及自然地理、经济发展与国家宏观政策因素综合考虑,设计针对21世纪初5年新的中国土地利用动态区划图,揭示土地利用变化的空间格局与驱动因素。总体上,21世纪初5年中国处于土地利用快速变化期,黄淮海平原、东南沿海地区与四川盆地城乡建设用地显著扩张,占用大规模优质农田,导致南方水田面积明显减少;西北绿洲农业发展与东北地区开垦导致北方旱地面积略有增加;受西部开发"生态退耕"政策的影响中西部地区林地面积显著增加,国家退耕还林还草政策成效明显,对区域土地覆盖状况的改善产生积极的影响;这一时段国土开发与区域发展战略的实施,包括"西部大开发"、"东北振兴"等国家重大政策,加之快速的经济发展是该阶段土地利用变化格局形成的主要驱动因素。
|
| [19] |
20世纪80年代末以来中国土地覆被变化的基本特征与空间格局 [J].https://doi.org/10.11821/dlxb201401001 URL [本文引用: 1] 摘要
土地利用/土地覆被变化(LUCC)是人类活动与自然环境相互作用最直接的表现形式,本文采用相同空间分辨率的卫星遥感信息源和相同的技术方法,对中国1980年代末到2010年土地利用变化数据进行定期更新。在此基础上,提出并发展土地利用动态区划的方法,研究土地利用变化的空间格局与时空特征。我们发现:1990-2010年的20年间,中国土地利用变化表现出明显的时空差异。"南减北增,总量基本持衡,新增耕地的重心逐步由东北向西北移动"是耕地变化的基本特征;"扩展提速,东部为重心,向中西部蔓延"是城乡建设用地变化的基本特征;"林地前减后增,荒漠前增后减,草地持续减少"是非人工土地利用类型变化的主要特征。20世纪末与21世纪初两个10年相比,中国土地利用变化空间格局出现了一些新特征,原有的13个土地利用变化区划单元演变为15个单元,且部分区划单元边界发生变化。主要变化格局特征为黄淮海地区、东南部沿海地区、长江中游地区和四川盆地城镇工矿用地呈现明显的加速扩张态势;北方地区耕地开垦重心由东北地区和内蒙古东部转向西北绿洲农业区;东北地区旱作耕地持续转变为水田;内蒙古农牧交错带南部、黄土高原和西南山地退耕还林还草效果初显。近20年间,尽管气候变化对北方地区的耕地变化有一定的影响,但政策调控和经济驱动仍然是导致我国土地利用变化及其时空差异的主要原因。2000年后的第一个10年,土地利用格局变化的人为驱动因素已由单向国土开发为主,转变为开发与保护并重。在空间格局变化的分析方法方面,应用"动态区划法"开展世纪之交两个10年中国LUCC空间格局变化的分析,有效揭示了20年来中国LUCC"格局的变化过程",即动态区划边界的推移、区划单元内部特征的变化与单元的消长等;以及"变化过程的格局",即土地利用变化过程与特征的分阶段区域差异,清晰刻画了LUCC动态区划中区划单元的消长,单元边界的变动,以及前后10年的变化强度特征,揭示了土地利用"格局"与"过程"之间的交替转化规律,以及不同类型和区域的变化原因,证明了该分析方法的有效性。
Spatiotemporal characteristics, patterns, and causes of land-use changes in China since the late 1980s [J].https://doi.org/10.11821/dlxb201401001 URL [本文引用: 1] 摘要
土地利用/土地覆被变化(LUCC)是人类活动与自然环境相互作用最直接的表现形式,本文采用相同空间分辨率的卫星遥感信息源和相同的技术方法,对中国1980年代末到2010年土地利用变化数据进行定期更新。在此基础上,提出并发展土地利用动态区划的方法,研究土地利用变化的空间格局与时空特征。我们发现:1990-2010年的20年间,中国土地利用变化表现出明显的时空差异。"南减北增,总量基本持衡,新增耕地的重心逐步由东北向西北移动"是耕地变化的基本特征;"扩展提速,东部为重心,向中西部蔓延"是城乡建设用地变化的基本特征;"林地前减后增,荒漠前增后减,草地持续减少"是非人工土地利用类型变化的主要特征。20世纪末与21世纪初两个10年相比,中国土地利用变化空间格局出现了一些新特征,原有的13个土地利用变化区划单元演变为15个单元,且部分区划单元边界发生变化。主要变化格局特征为黄淮海地区、东南部沿海地区、长江中游地区和四川盆地城镇工矿用地呈现明显的加速扩张态势;北方地区耕地开垦重心由东北地区和内蒙古东部转向西北绿洲农业区;东北地区旱作耕地持续转变为水田;内蒙古农牧交错带南部、黄土高原和西南山地退耕还林还草效果初显。近20年间,尽管气候变化对北方地区的耕地变化有一定的影响,但政策调控和经济驱动仍然是导致我国土地利用变化及其时空差异的主要原因。2000年后的第一个10年,土地利用格局变化的人为驱动因素已由单向国土开发为主,转变为开发与保护并重。在空间格局变化的分析方法方面,应用"动态区划法"开展世纪之交两个10年中国LUCC空间格局变化的分析,有效揭示了20年来中国LUCC"格局的变化过程",即动态区划边界的推移、区划单元内部特征的变化与单元的消长等;以及"变化过程的格局",即土地利用变化过程与特征的分阶段区域差异,清晰刻画了LUCC动态区划中区划单元的消长,单元边界的变动,以及前后10年的变化强度特征,揭示了土地利用"格局"与"过程"之间的交替转化规律,以及不同类型和区域的变化原因,证明了该分析方法的有效性。
|
| [20] |
|

/
| 〈 |
|
〉 |