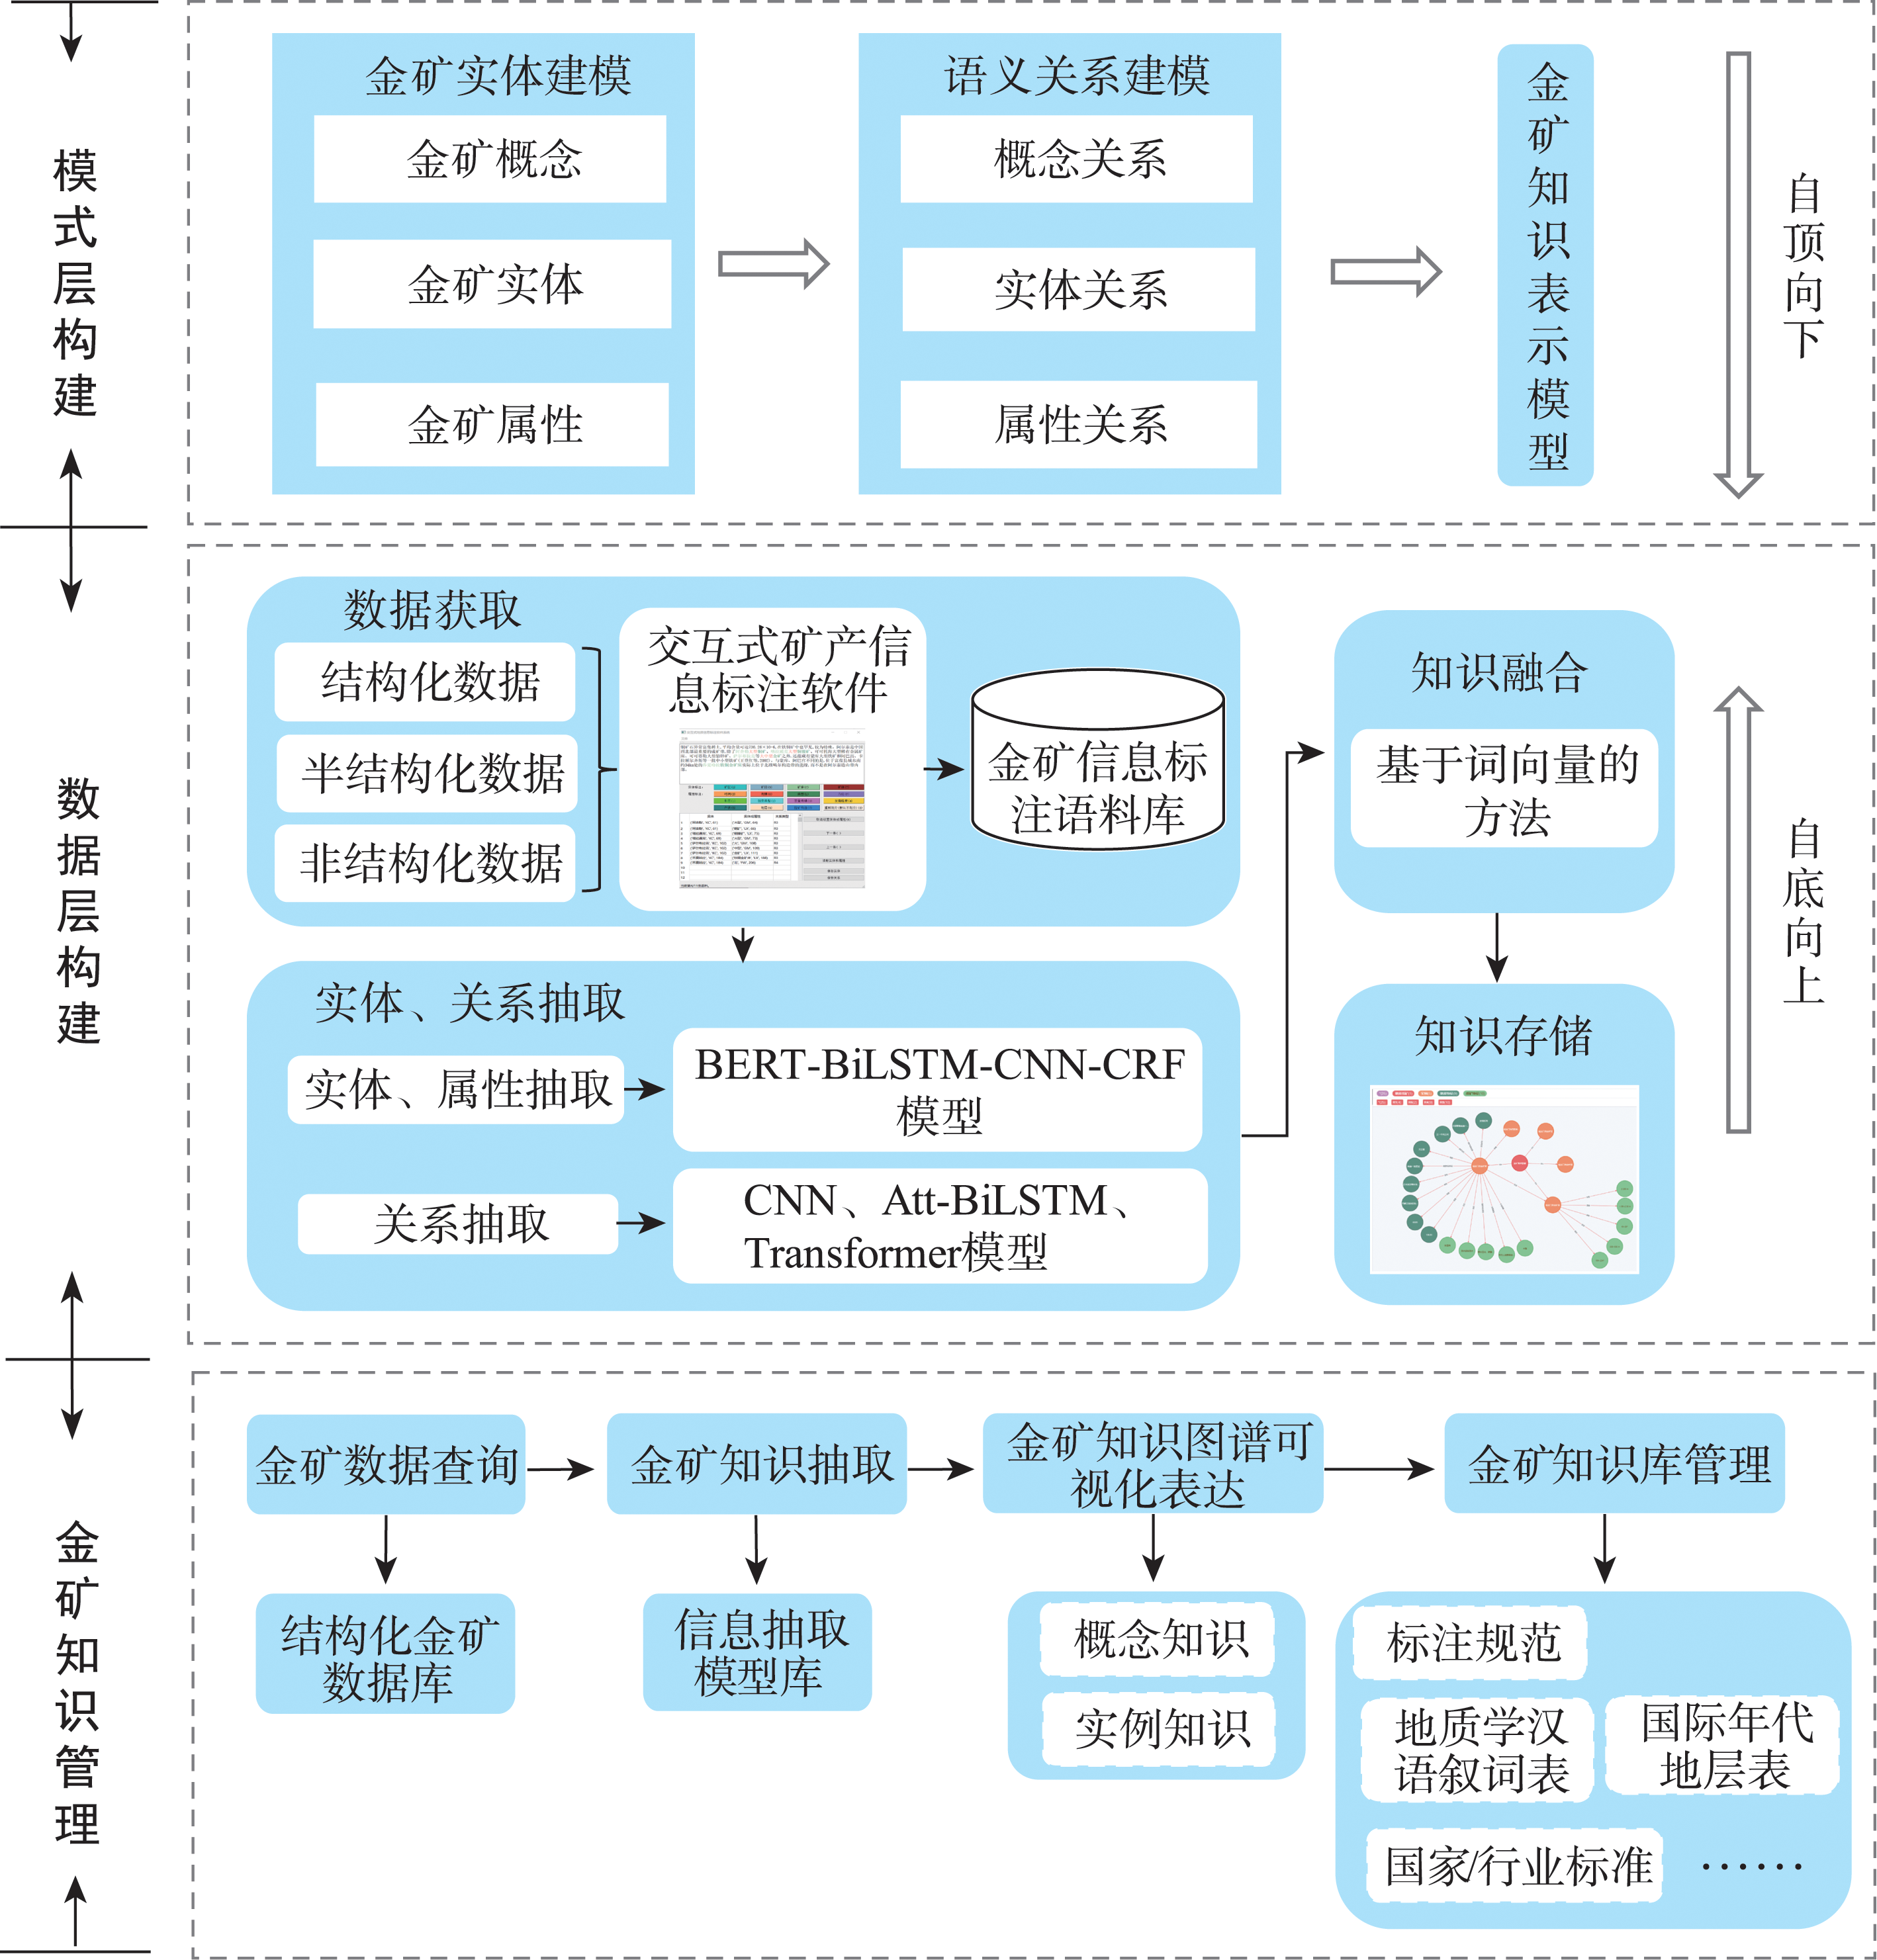
Geological and mineral resource survey and scientific research in "geology, geophysics, geochemistry, and remote sensing " have established a large amount of geological and mineral survey data, which contain rich knowledge related to mineralization and distribution of gold mine, such as the metallogenic and tectonic setting, geological environment of occurrence, geological characteristics of mineral mine, genesis and metallogenic model of mine, and so on. The transformation from massive mineral related data to effective metallogenic knowledge has become one of the most important breakthroughs to improve the accuracy of geological prospecting. To solve this problem, through the in-depth analysis of knowledge representation, information extraction, and knowledge fusion in knowledge engineering, this paper explores the knowledge graph construction method of gold mine based on ontology. Firstly, referring to industry norms, gold mine knowledge base, and reference material of geological and mineral resource exploration, the metallogenic model of gold mine is sorted out, and the gold mine concept, gold mine entity, gold mine relationship, gold mine geological attribute, and gold mine metallogenic attribute are determined. In addition, the schema layer of gold mine knowledge graph is constructed by using the top-down ontology knowledge representation method, which represents the conceptual model and logical basis of gold mine knowledge graph. Secondly, based on structured, semi-structured, and unstructured multi-source heterogeneous geological data, the deep learning model is used to realize gold mine knowledge extraction, semantic analysis, and knowledge fusion, which enriches the data layer of gold mine knowledge graph and provides data support for gold mine knowledge graph. The gold mine knowledge graph is constructed in a bottom-up way, and the gold mine knowledge triplet is stored by Neo4j graph database, in which nodes represent gold mine concept, gold mine entity, and gold mine attribute value, while edges represent relation and attribute. Finally, the gold mine knowledge management system is developed based on the graph database. It can be applied to the management of gold mine data, acquisition of knowledge, visualization representation of gold mine knowledge graph, inquiry of knowledge, management and presentation of knowledge base, and other functions well, so as to lay a foundation for the intelligent analysis and mining of geological big data. This study develops a geological prospecting method driven by data and knowledge, and provides a reference for identifying, controlling, and managing mineral resources, which can improve the prospecting accuracy in geological exploration.
With the development of big data and artificial intelligence, the scope of digital earth modeling has extended to full-time holography beyond the earth surface. However, the current data model of digital earth still remains in the data modelling of earth tile or grid subdivision. This model severely limits the application of scenario-based and intelligent digital earth development. This paper proposes the concept of digital holographic earth and a corresponding data organization model of earth data cube. By using global multi-level grid reference system to describe and express multi-scale space and using two or three-dimensional grid cells to describe spatial positions, the traditional spatiotemporal description of "longitude, latitude, elevation, and time" is transformed to a new spatiotemporal description system of "time granularity, time coverage, grid position, and grid scale". The proposed model is characterized by the dimensions of "time-space-scale-attribute" based on spatiotemporal big data in the digital earth. The model encapsulates vectors, rasters, grids, time series arrays, and 3D models into an unified system. This unified system ensures that any data value of a specific earth data cube is aligned perfectly in time, space, and scale, which solves the problem of multi-dimensional or spatiotemporal dynamic fusion of big earth data. Finally, this paper develops a deep-time and spatiotemporal dynamic visualization simulation system to verify the data model based on the requirements of the Deep-time Digital Earth International Science Program.

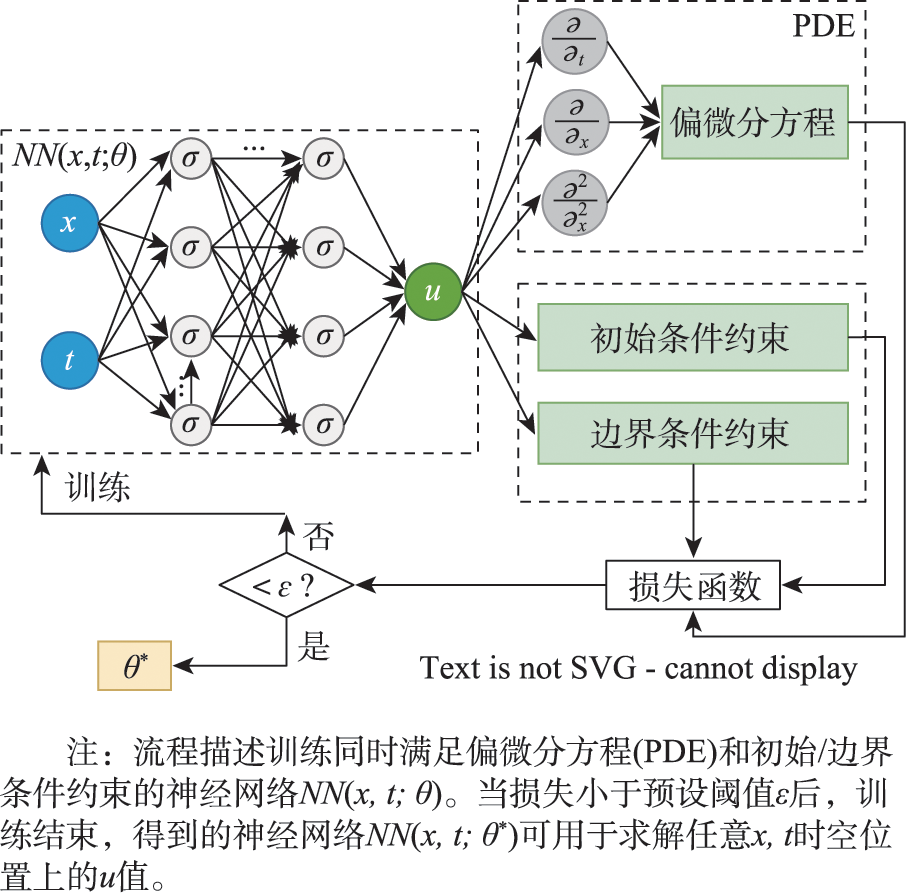
Scientists still cannot fully understand and explain many complex physical phenomena and dynamic systems, which cannot be described by deterministic mathematic equations and be analyzed and predicted through compact physical mechanistic models. With the ever-increasing of observational data, data-driven machine learning methods can effectively describe many complex non-linear phenomena. Nevertheless, pure data-driven models still have shortcomings in representation, interpretation, generalization capabilities, and sample efficiency. Conventional machine learning methods are confronted with challenges brought by spatiotemporal heterogeneity and sample sparsity. Recently, Physics-Informed Machine Learning (PIML) can effectively leverage observation data to describe and analyze dynamical systems when physical principles are uncertain. PIML has gain wide attention and been extensively applied in physics, computer science, biology, medical science, and geosciences. In recent years, artificial intelligence and machine learning technologies have been widely applied in geography, especially in GIScience and remote sensing, attracting wide research interests of geographers. This line of research is termed GeoAI and has become a cutting-edge research frontier in geography. PIML methods integrate the ideas of model-driven and data-driven methods, introducing new research paradigms for GeoAI and improving the description and prediction of complex geographical phenomena. This survey first summarizes recent progress in this domain from the perspectives of the representation of physical priors and the integration of physical priors in machine learning methods. Physical prior refers to existing independent knowledge that is already available before building machine learning models. This survey reviews the representation of physical priors from the aspects of augmented data and customized features, physical laws and constraints, governing equations as well as geometric properties. We also review how physical priors are integrated into various machine learning models, including constraint modeling, auxiliary task design as well as model training and inference. Based on the PIML survey framework, we explore the relationships between spatiotemporal priors and other physical priors, before briefly reviewing and summarizing typical case studies of spatiotemporal prior-informed GeoAI research. We also discuss the research agenda and future prospects of spatiotemporal prior representation and the spatiotemporal prior-informed GeoAI in the context of geo-machine learning and GeoAI frontiers. In light of fast progress of PIML, we contend that GeoAI studies that are well informed by spatiotemporal priors can gradually establish a generic geographical representation, analysis, prediction, and interpretation framework, which not only helps handle many classical problems in GIScience but also addresses future profound challenges of human being by encouraging geographers to explore more research opportunities when collaborating with researchers from other disciplines.
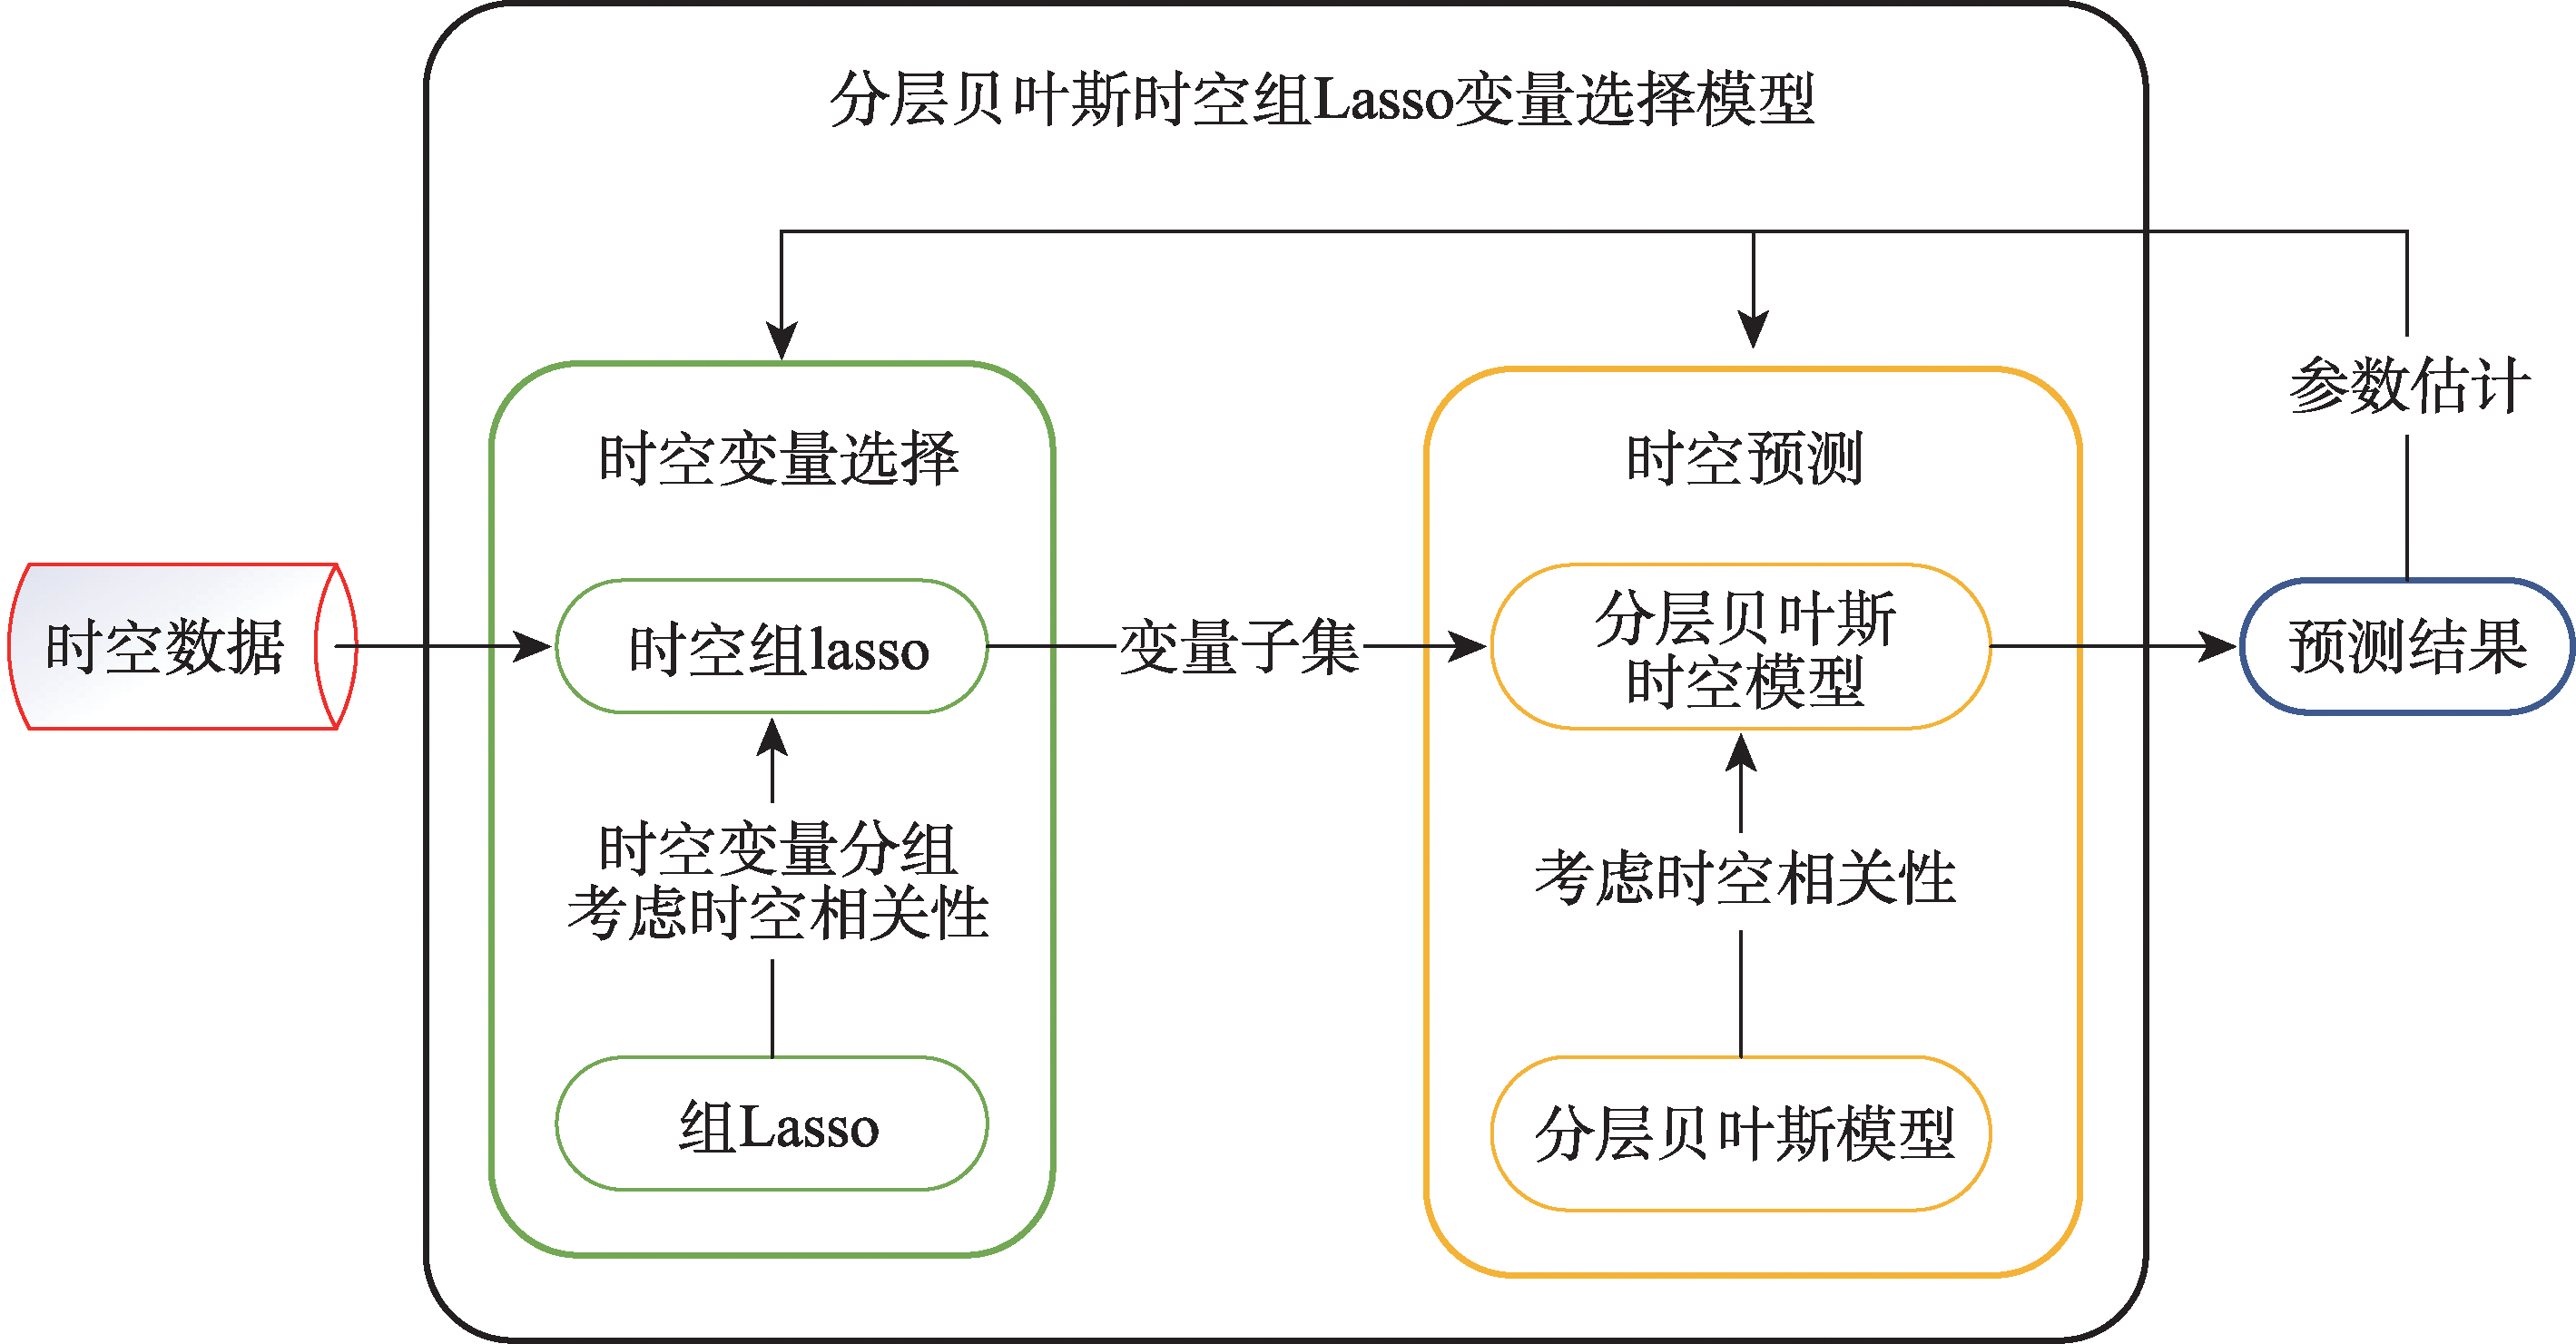
It is one of the important issues in the field of spatio-temporal data analysis to effectively select variables from high-dimensional and large-scale spatio-temporal data. As the most important features of spatio-temporal data, the temporal and spatial correlation of spatio-temporal data must be considered to make effective variable selection. However, existing spatio-temporal data variable selection methods do not fully consider the spatio-temporal correlation, and the variable selection stage is separated from the prediction stage. Moreover, these methods often require manual setting of a threshold of the number of spatiotemporal points to determine variables selection, which may lead to inaccurate selection of the subset of variables that have the greatest impact on the dependent variable, and result in poor prediction performance. In this paper, we propose a variable selection method based on the spatio-temporal group Lasso and the hierarchical Bayesian spatiotemporal model, called the hierarchical Bayesian Spatio-temporal Group Lasso Variable Selection method (HBST-GLVS). In this method, the spatio-temporal expansion is carried out simultaneously in the variable selection stage and prediction stage, and the best nearest neighbor time domain and space domain are determined adaptively through cross validation. In order to obtain the best prediction performance from the selection of variables, the selection of spatio-temporal variables and the prediction of spatiotemporal models are placed under the same framework, so that the selected variables and parameters correspond to the best prediction performance. In order to solve the problem of manual setting of the threshold of the number of spatio-temporal points, the variable selection is processed from the perspective of the entire sequence of spatio-temporal variables, without the threshold of the number of spatio-temporal points. Specifically, this method uses spatio-temporal group Lasso for variable selection, fully considers spatio-temporal correlation by introducing maximum time lag and maximum spatial neighborhood, and applies global penalty to all spatio-temporal points of the same variable based on spatio-temporal data continuity, thus avoiding the lopsidedness caused by artificial setting of thresholds. The effect of variable selection is validated using a hierarchical Bayesian spatio-temporal model, and the variable selection process and the model validation process are placed under the same framework for the adjustment of parameters, so as to obtain the optimal subset of variables. Our results show that the Root Mean Square Error (RMSE) and Mean Square Error (MAE) of the method in this paper can be reduced by 9.6%~25.7% and 6.6%~15.9%, based on Beijing air quality dataset and Portland traffic flow dataset, respectively, compared with the existing methods.
Over the past few decades, the rapid development of satellite technologies has led to significant advancements in multi-level, multi-angle, all-directional, and all-weather observation of the Earth. Remote sensing data have been greatly enriched and widely used in many scientific fields and provide important source information for geospatial analysis, environmental monitoring, disaster management, and etc. However, it is difficult to guarantee the data reliability and availability due to the inconsistency in data quality and difference in spatial and temporal resolutions. Additionally, a single remote sensing image can also be processed using different algorithms, and the process chain for generating a remote sensing product is often complex, making it difficult to determine the remote sensing product quality. To address these issues, this paper focuses on the provenance information model for multi-source remote sensing images that allows users to track the origin, derivation, and processing history of a remote sensing product. By embedding provenance information into remote sensing image metadata, users can evaluate the quality, reliability, and availability of remote sensing data products. To achieve this goal, this paper proposes a conceptual provenance model based on the distribution and processing of remote sensing images. This conceptual model includes four key elements (event, entity, relationship, and attribute) that are associated with the data derivation. Secondly, in order to improve the interoperability, this paper inherits and extends the W3C PROV-DM provenance model, and constructs a mapping framework between the remote sensing image provenance conceptual model and the W3C PROV-DM model. Furthermore, this paper enriches the metadata model and Unified Metadata Model (UMM) model with provenance information. This enhanced metadata model can provide users with a more comprehensive understanding of remote sensing data products. At the same time, this paper proposes a method for optimizing remote sensing data queries based on provenance information, which can effectively reduce the query time. This method enables users to filter out irrelevant data and retrieve desired data quickly and efficiently, leading to more efficient use of remote sensing data products. In summary, the proposed provenance information model enables users to track the provenance information of remote sensing data products, evaluate their availability and reliability, and optimize the query process. These contributions are of great significance for evaluating the accessibility and reliability of remote sensing image products.
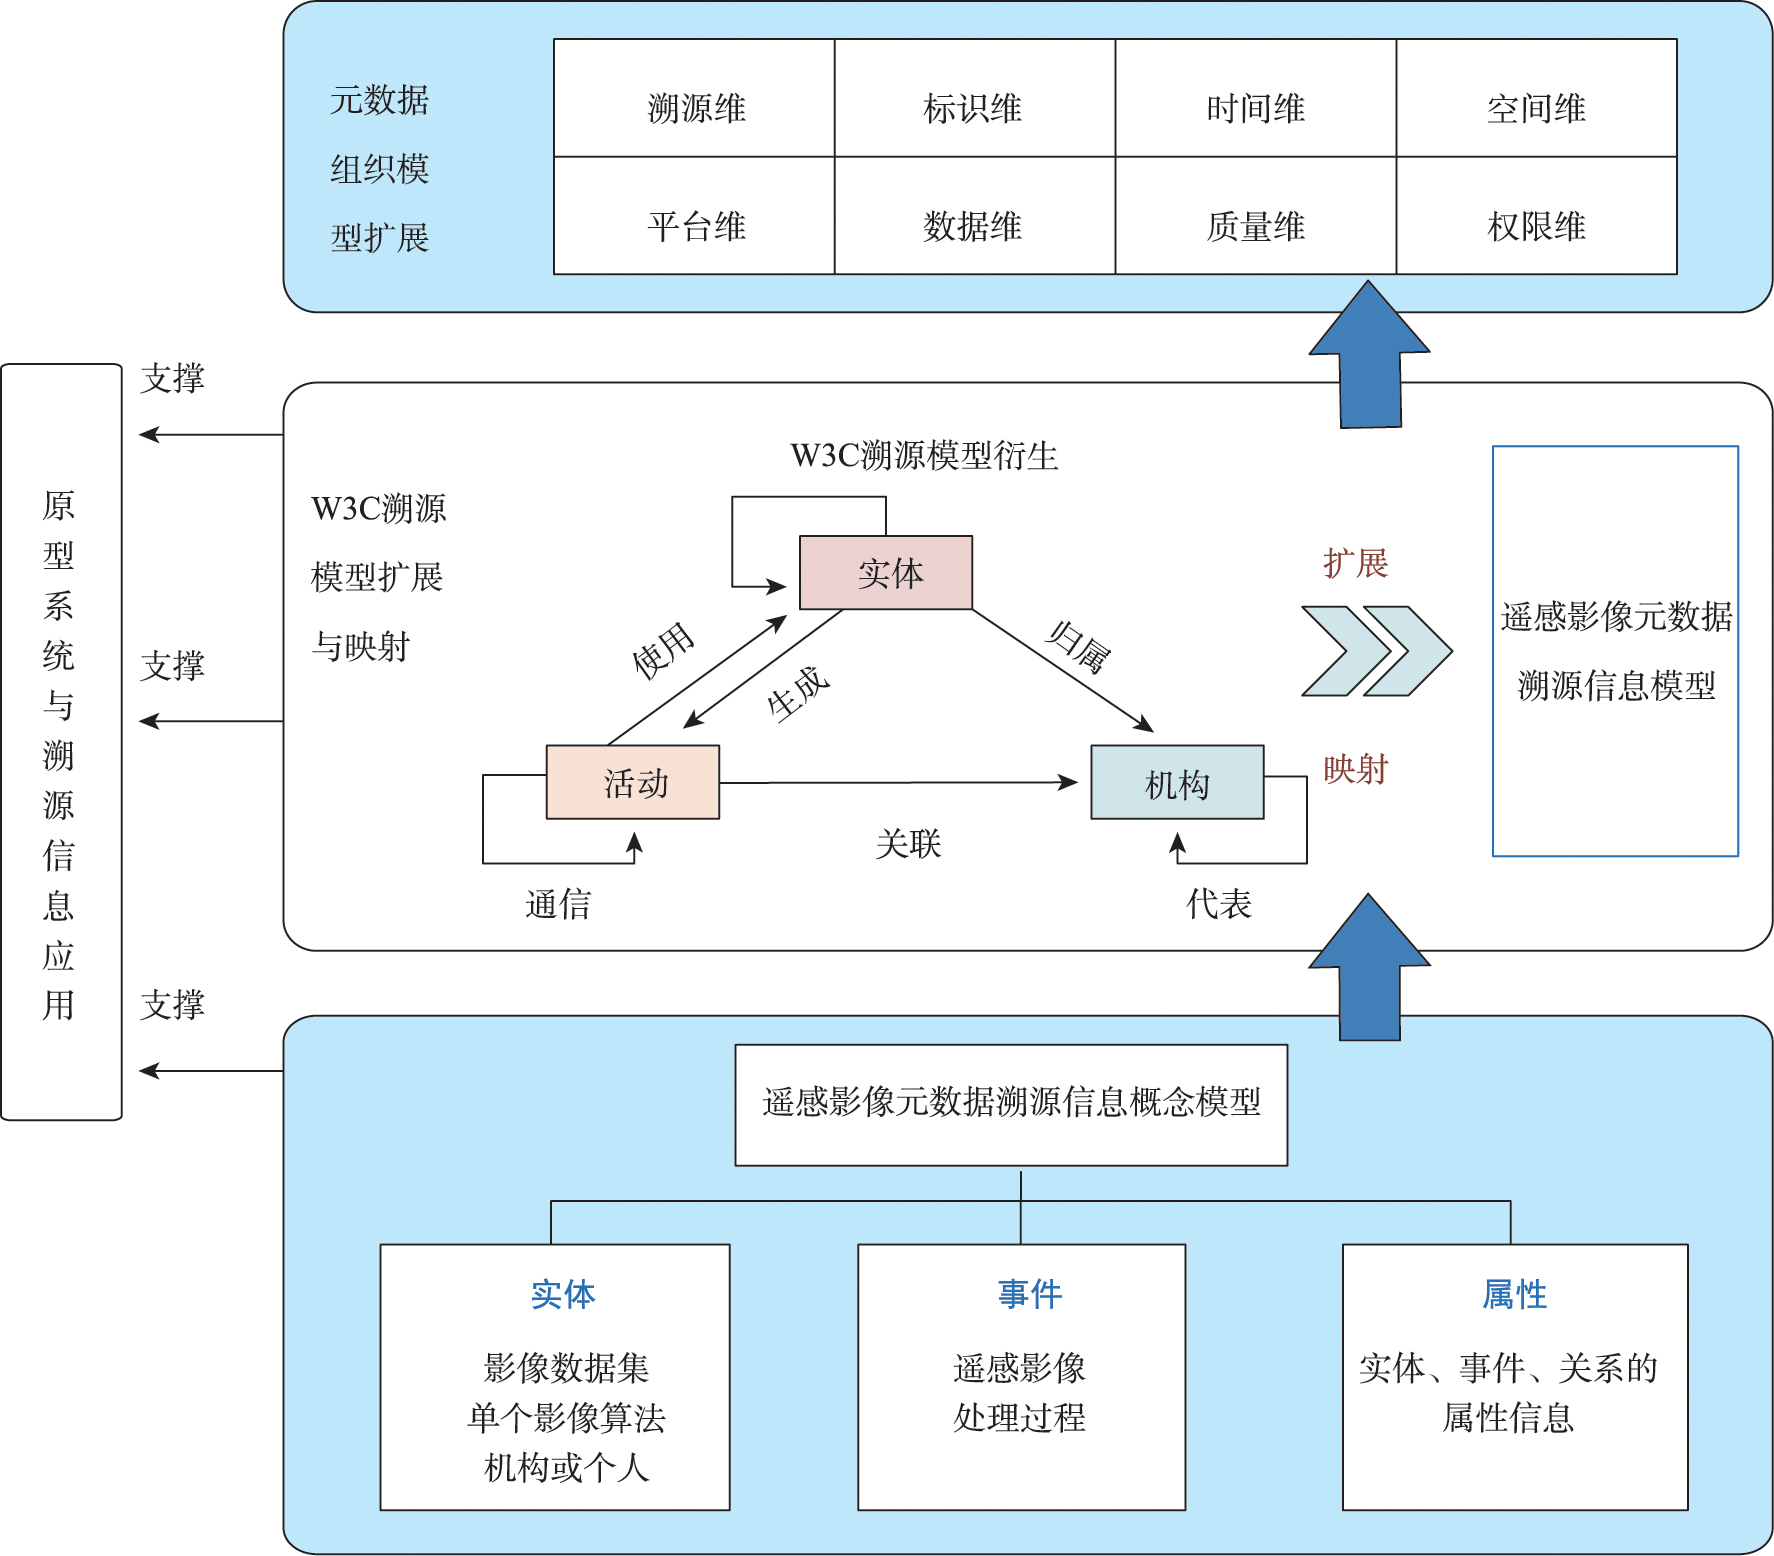
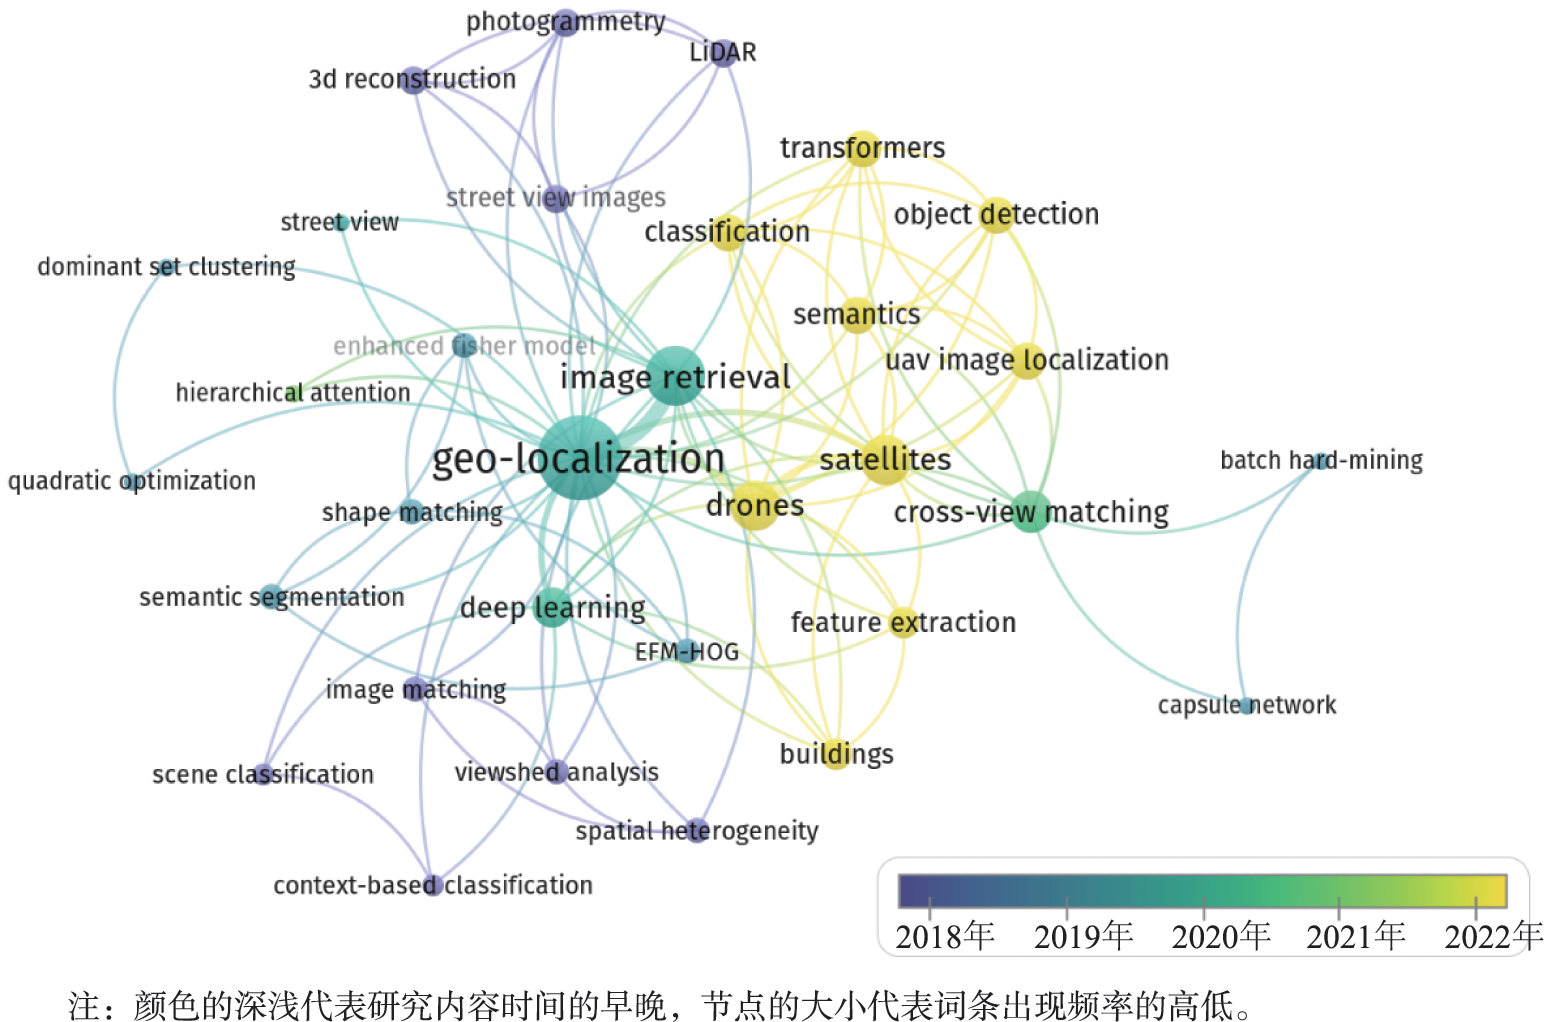
Image geo-localization is a technique that obtains the geographic location information of an image through a series of methods, so as to establish a mapping relationship with the real geographic space. This technique is important for further image information mining and has potential application value in cyberspace surveying and mapping, intelligence acquisition, user outdoor positioning, and augmented reality. Despite the tremendous progress in the field of computer vision, high-precision automatic geo-localization of images still needs to be addressed due to the involvement of multiple fields such as image feature extraction, large-scale data retrieval, large-scale point cloud processing, deep learning, geographic information feature extraction, geometric modeling and reasoning, semantic scene understanding, context-based reasoning, and multiple data fusion. This paper reviews the progress of image geo-localization research, mainly including image geo-localization methods, image geo-localization datasets, image geo-localization evaluation methods, and summary and prospect of image geo-localization. Firstly, image geolocation methods are classified into three categories, i.e., image retrieval, 2D-3D matching, and cross-modal retrieval, according to the relevance of the research content. Secondly, the datasets and evaluation methods used for image geo-localization research are categorized and summarized. The geo-localization datasets include image datasets, cross-view datasets, Structure from Motion (SfM) datasets, and multimodal datasets, etc. The image geo-localization evaluation metrics include Top-k candidates, localization error, position and orientation error per video frame, and accuracy/recall. Finally, the current status of image geo-localization research is analyzed, and the future research directions of image geo-localization are outlined in terms of global geo-localization, natural area geo-localization, multi-method fusion for geo-localization, Point of Interest (POI) data-based geo-localization, and pre-selected location refinement.
Trajectory clustering is a hot research topic in the field of spatial data mining, which is of great significance to many applications such as urban traffic control, road network construction and update. Trajectory clustering involves grouping similar trajectories into clusters where trajectory similarity measurement and clustering parameter setting are two core issues in the process of clustering. However, due to the complex morphological and structural characteristics of trajectories, the existing trajectory similarity measures are sensitive to noise or do not fully consider the consistency of trajectory motion direction. In addition, most clustering algorithms still need to manually set parameters, and the quality of clustering results is affected by the subjective experience of users. To address the above problems, this paper proposes an adaptive trajectory clustering algorithm. The proposed algorithm has two main components: a new trajectory similarity measure called Directed Segment-Path Distance (DSPD) and an improved hierarchical clustering algorithm based on the concept of central trajectory. The DSPD metric is a fusion of the spatial proximity and motion direction features of trajectories, providing a robust similarity measure. The enhanced hierarchical clustering algorithm extends the Ward hierarchical clustering algorithm by defining central trajectories and use the DSPD metric as the trajectory similarity measure. In addition, the proposed algorithm also utilizes the clustering characteristic curve to determine the optimal clustering parameters automatically. This eliminates the need for manual parameter tuning and reduces the subjectivity of clustering results. To evaluate the effectiveness of the proposed algorithm, experiments were conducted on both the simulated datasets and real-world trajectories of Wuhan. We first compared the effect of the DSPD with other commonly used trajectory similarity measures (i.e., Hausdorff distance, Fréchet distance, DTW distance, and LCSS distance) using the same clustering algorithm on the 11 sets of simulated datasets. The evaluation was based on the Adjusted Rand Index (ARI). Then we conducted another comparative analysis to access the effectiveness of the improved clustering algorithm in contrast to an average link-based hierarchical clustering algorithm. Finally, to verify the practicability of the proposed algorithm, we applied it to the process of road network updating. The experimental results show that the proposed DSPD measure outperforms alternative distance metrics on the ARI evaluation indicator. It can effectively distinguish moving trajectory clusters in different directions while considering the spatial proximity of trajectories, thus enhancing the accuracy and effect of the trajectory clustering. Furthermore, the proposed algorithm can significantly reduce the subjectivity of clustering results and provide suggestions for practical applications such as urban road network extraction and update.

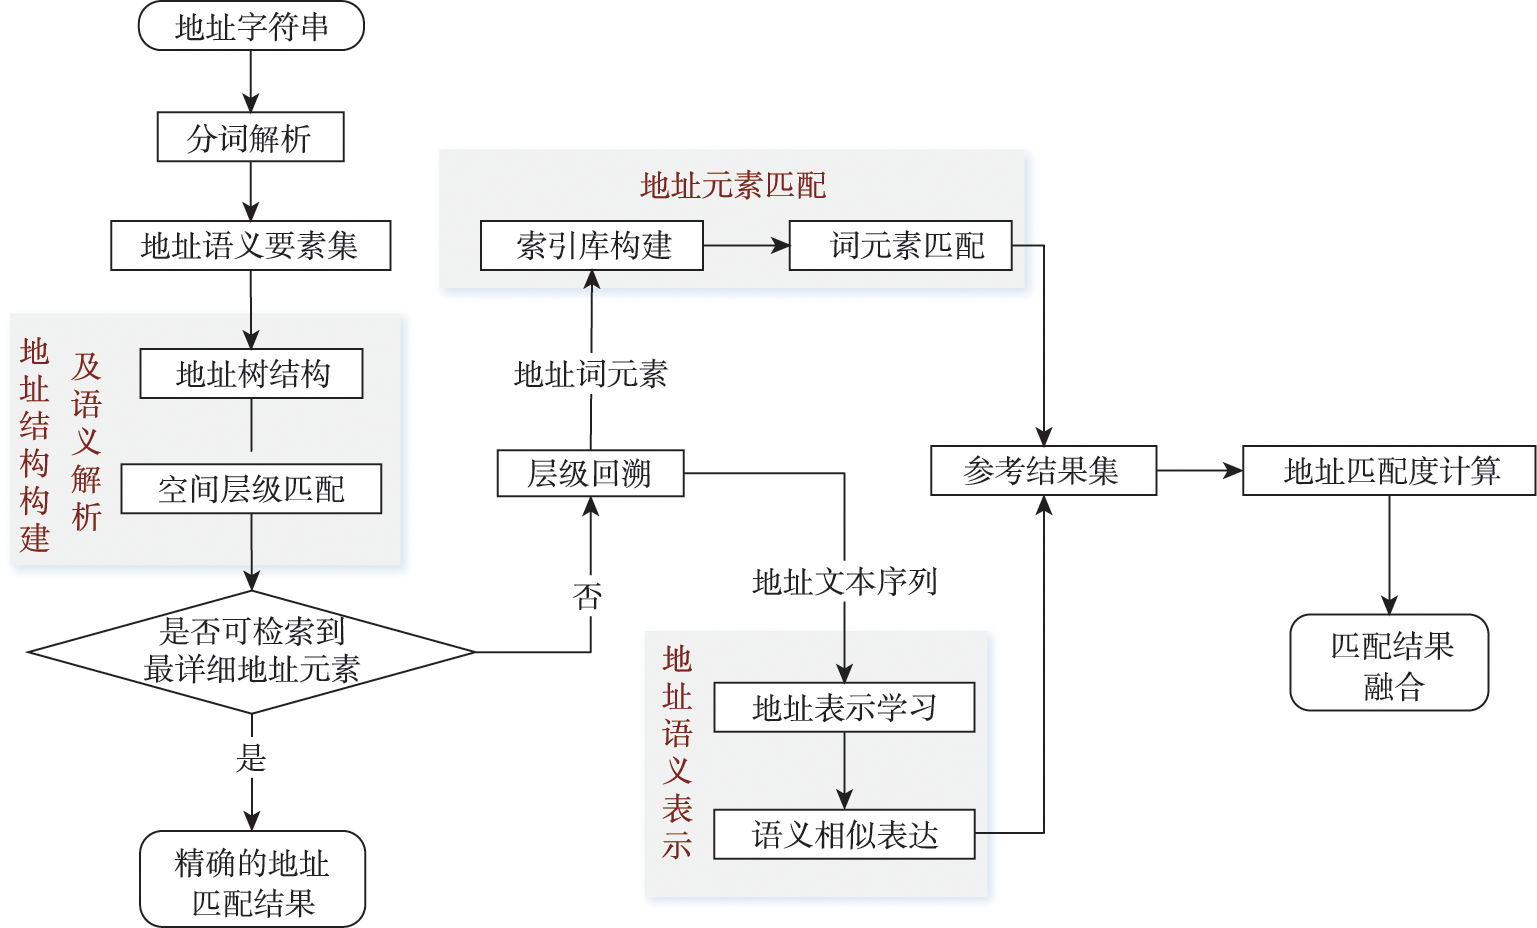
Address matching refers to the process of matching the description address with the address in the standard address library, which is the core foundation of geocoding. It can convert the location description information into spatial coordinates, so as to build the association between texts and coordinates. Usually, Chinese address data has the problems of ambiguous expression, low standardization, and poor overall data quality. The current situation of Chinese data have greatly increased the construction cost of address reference library, which puts forward higher requirements for address matching algorithms and prompts the exploration of adopting integrated address matching strategies in practice. According to the fact that there has limited interaction between the existing address matching algorithms and address database feedback, this paper presents an integrated processing strategy for address matching. It describes a progressive logical matching strategy from vocabulary, structure, and semantics levels, which can support data organization while realizing deep text parsing. The vocabulary level parses the address structure to achieve word segmentation and text filtering from the character perspective; The structure level defines data organization of the address model and completes the quick indexing under hierarchical structure; The semantic level is the formal expression of address semantics, integrating semantic understanding and information extraction methods. Besides, on the basis of comprehensive address element filtering, hierarchical structure subdivision, and semantic understanding, we continuously feed back the fully parsed address data as reference to achieve the algorithm logic binding and results integration supported by the database. Thus, the efficiency of engine construction and the quality of algorithm are effectively improved. In order to verify our proposed strategy,we select the address data of Deqing County, Huzhou City, Zhejiang Province to carry out a comparison experiment. The results show that our strategy achieves stable and satisfied results indicated by matching rate, accuracy, and time indicators. Compared with the classical address matching algorithms, our strategy has obvious advantages in increasing the accuracy and saving time. The average matching rate is 92.83%, and the accuracy rate is 95.37%, under the low repetition rate multiple sampling experiment. Our results indicate that the proposed strategy can effectively solve the matching problems such as address element missing and approximate semantic calculation and improve the matching degree, matching rate, and matching efficiency. For addressing text elements that may indicate multiple spatial meanings, it is necessary to further combine spatial topology analysis to optimize the accuracy of address element recognition.
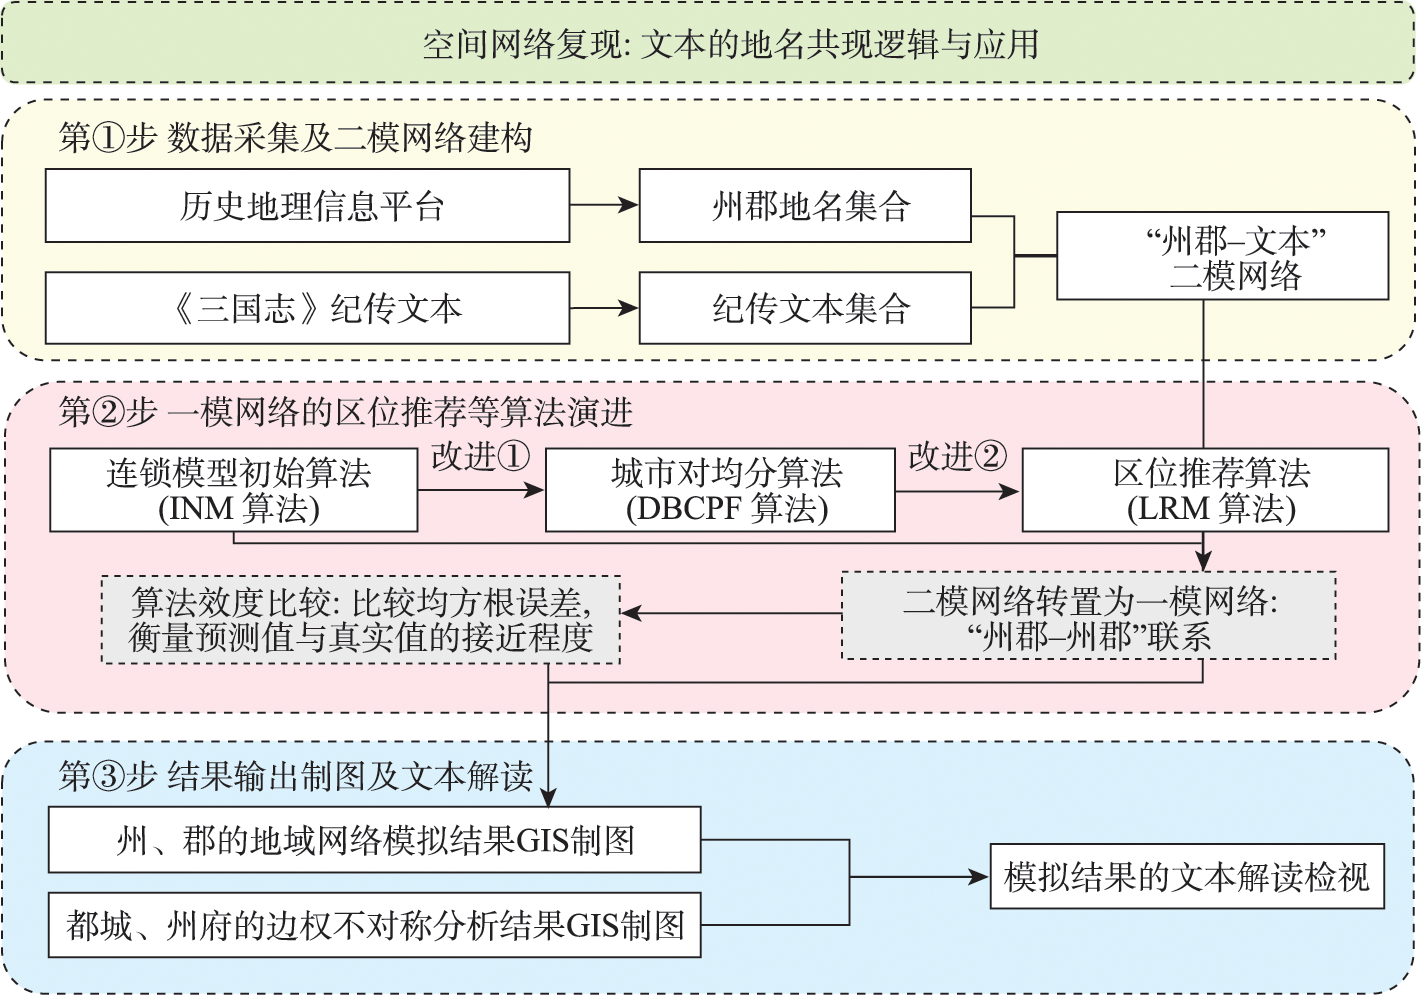
Digging out the text information that characterizes connections between different cities has gradually become a critical pathway to investigate the regional intercity links and networks. The research on the toponym co-occurrence network based on biographical books is of great significance for deepening the understanding of historical geographical elements. Based on the review of the existing works, this paper puts forward a novel method to calculate the intercity connections based on the toponym co-occurrence word frequency, considering both the weight of the rareness of toponym and regional dominance asymmetry. This approach realizes the expression of geographical and hierarchical features in the network analysis of the History of The Three Kingdoms and realizes the identification of regional imbalance. Results show that (1) compared with the algorithm of Interlocking Network Model (INM) and the algorithm of Divide-By-City-Pair-Frequency (DBCPF), the results of the proposed algorithm of Location Recommendation Model (LRM) reflect the asymmetry of edge weights. In the validity test, the validity of the location recommendation algorithm is increased by 5‰ with a lower probability error compared to the existing algorithms, and the effect of the recurrence of place name word frequency is more robust; (2) the calculation results of the existing algorithms are symmetric, while the asymmetric regional correlation data obtained by LRM provides a statistical basis for identifying the node hierarchy of the regional network.
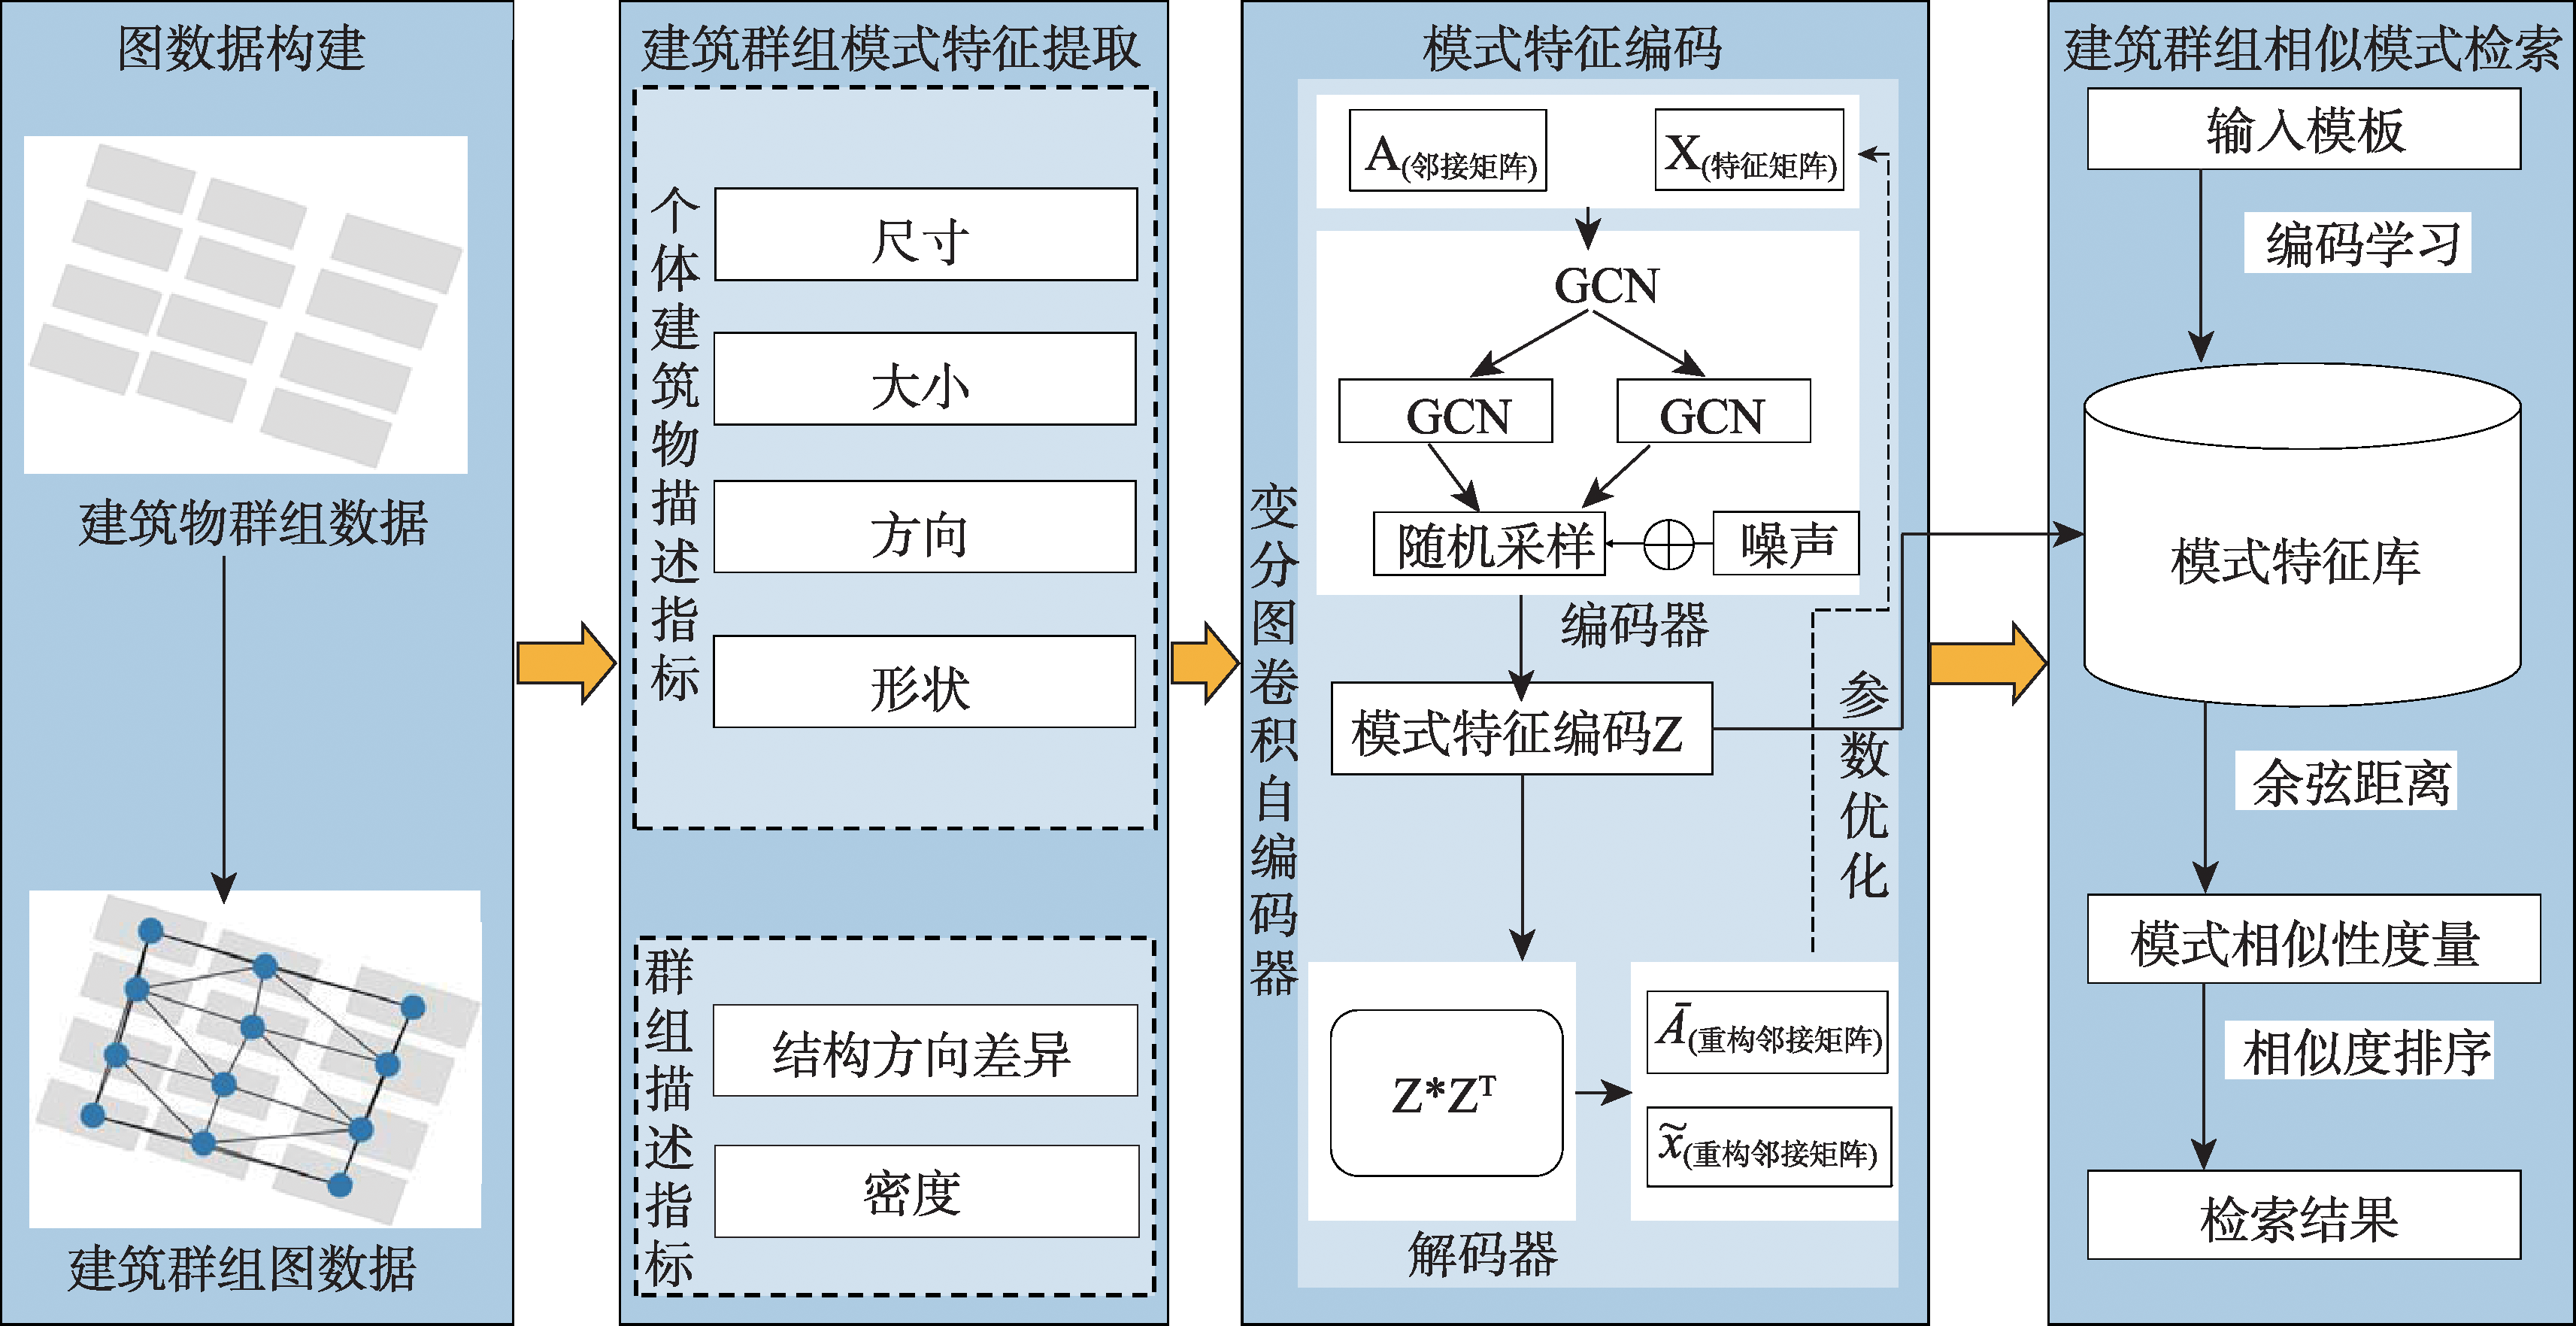
To address the problems of weak model generalization and insufficient utilization of spatial information due to the strict constraints in the fusion method of geometric features and spatial relations and the spectral domain similarity metric in the current building group similar pattern retrieval, this paper proposes a similar retrieval model based on the variational graph convolutional auto-encoder. Firstly, the minimum spanning tree is used to construct the building group graph structure and embed the building description features into the graph nodes to realize the quantified representation of the building group pattern. Secondly, in the reparameterization module of the variogram self-encoder, the mixed noise is generated by fusing the four-dimensional hyperchaotic system and Gaussian distribution to improve the generalization ability of the model by increasing the randomness of sampling. Then the graph convolution and pooling are used instead of fully connected layer to retain more spatial information. And the low-dimensional features are processed to obtain the feature encoding of building group patterns. Finally, the cosine distance is used to obtain the similarity between the building group to be retrieved and the building group in the pattern encoding library, so as to achieve the similarity retrieval of building group patterns. The experimental results show that the proposed model can effectively extract the pattern features of building groups and realize end-to-end similar pattern retrieval of building groups through unsupervised learning, which provides a new idea and method for automatic classification and similarity retrieval of building group patterns.
The integration of mobile augmented reality and geographic information system is becoming an ideal platform for spatial information visualization. Aiming at the problems of the inaccurate description of indoor spatial information location, weak reasoning spatial structure, and limited scene understanding ability in existing augmented reality tracking and registration techniques, this paper proposes an online learning tracking and registration method under spatial layout constraints. Firstly, the image feature matching algorithm is used to estimate the relative initial pose of the camera. Next, the end-to-end encoding-decoding network is used to extract the edge and semantic feature information of the indoor scene, and the 2D layout hypothesis is generated. Then the greedy strategy is used to refine the 2D layout hypothesis and extract the key coordinate point information of the corresponding layout. Finally, the semantic feature and the key coordinate point of the layout are taken as constraints to jointly optimize the initial pose of spatial information. In the complex indoor scene, the maximum position error of the registered virtual model is 9 cm, the maximum scaling error is 17%, and the maximum rotation error is 16 °. The experimental results show that the proposed method can add constraints to spatial information registration and achieve accurate registration in indoor scenes with a strong scene understanding ability.

The street network channels people's routine activities, which in turn affects the distribution of crime incidents. Therefore, the street micro-environment is crucial to the fine-grained understanding and explanation of the spatial distribution of street crime. In the existing research on street micro-environment extraction from street view images, semantic segmentation technique is often used to calculate the pixel proportions of various elements, without identifying individual features and objects on street. Recently, some scholars have combined semantic segmentation and object detection technologies to extract complex street environment features, generating both pixel proportions and object counts. However, no research has compared the associations between street crime and the micro-environment features extracted by the two methods. In order to explore this issue, this study used the above two methods to extract street micro-environmental features from Baidu Street View images. The first method used semantic segmentation technique to extract pixel proportions of all features. The second method combined a semantic segmentation and an object detection technology to extract the pixel proportions or counts of individual features, e.g., sidewalk, building, wall, fence, tree, and grass were measured as pixel proportions, and people and light posts on street were measured as counts. After controlling for land use mixture, concentrated disadvantage, street density, length of street segment, and facilities that attract or generate crime, zero-inflated negative binomial regression models were constructed to assess the impacts of the street micro-environmental features on street property crime, such as street theft and pickpocketing. The above two street micro-environment measurements were added to the models separately, and their influences on street property crime were then compared. The results show that: (1) compared with the conventional semantic segmentation method, adding the street micro-environment features extracted by combining semantic segmentation and object detection techniques increased the model performance by 7%. Specifically, the number of pedestrians obtained by the object detection method can better reflect the actual size of people on the street than the pixel proportion of pedestrians obtained by the semantic segmentation method, resulting a stronger association between pedestrians and street property crime. Its regression coefficient increased from 0.09 to 0.32, and the order of the absolute value of the regression coefficient increased from the tenth place to the third place; (2) the street micro-environment features extracted from street view images can effectively explain the occurrence of street property crimes. Crime targets and activity support features can significantly affect street property crime. Specifically, there were significant positive associations between the number of pedestrians on the street and street property crime, and significant negative associations between pixel proportions of sidewalks, buildings, trees, lawns, and green-rate, and the street property crime. This research adds more evidence to the literature of crime geography and environmental criminology, especially for Crime Prevention Through Environment Design (CPTED).

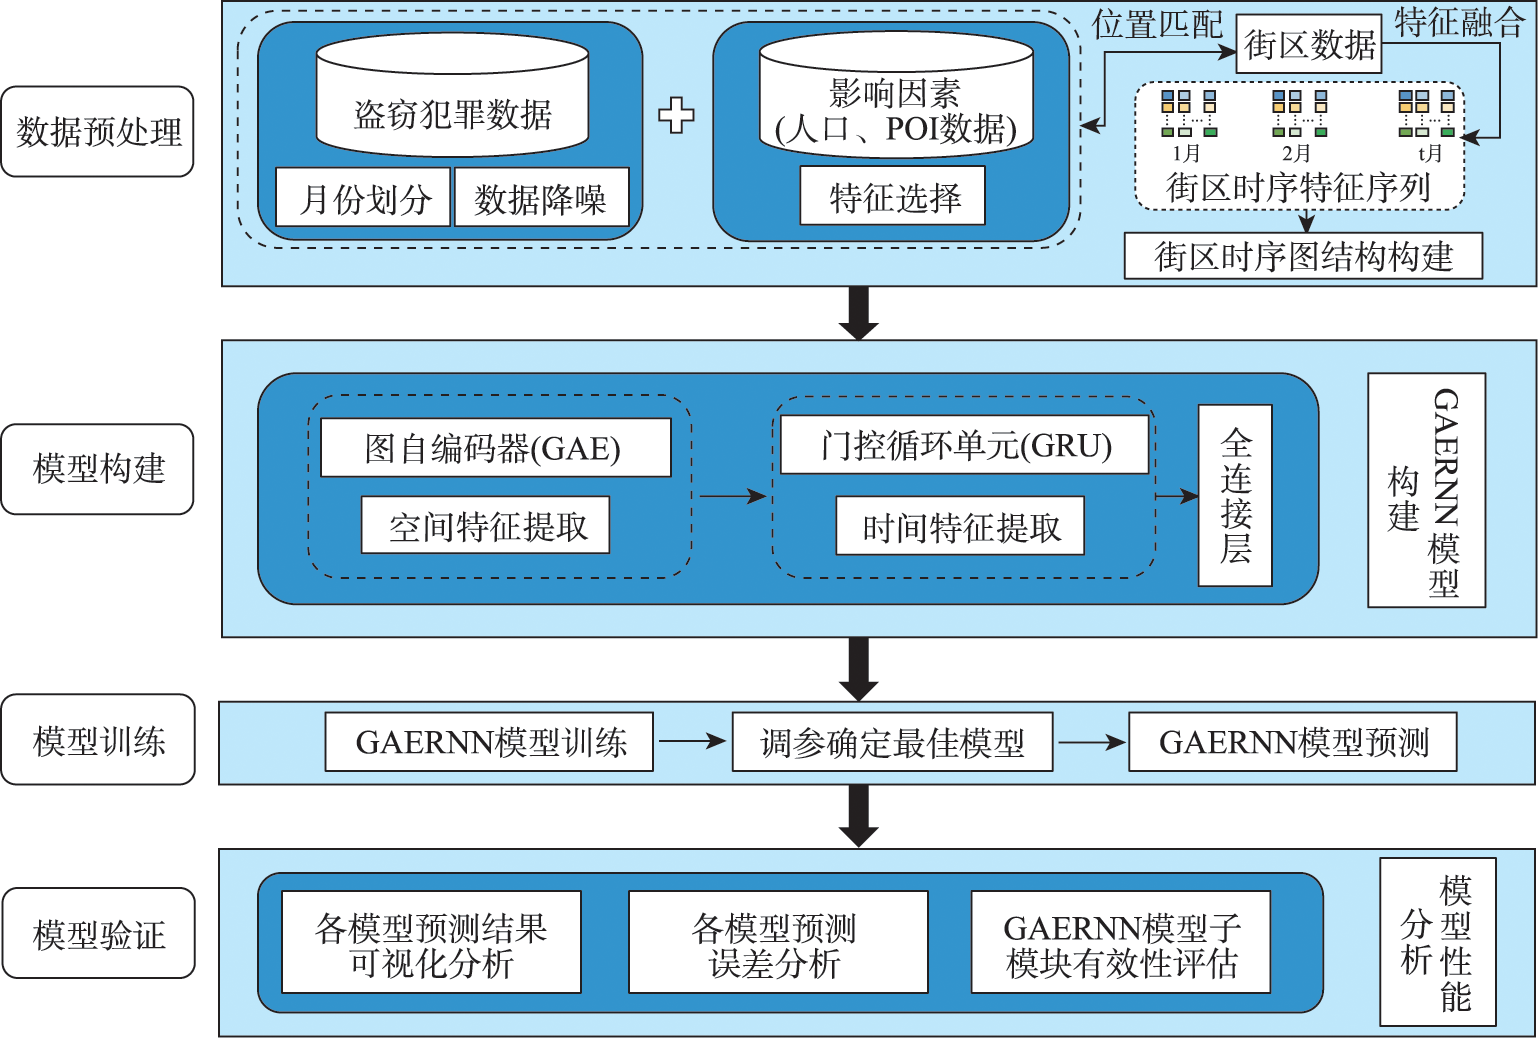
Crime prediction is a prerequisite for crime prevention. Forecasting crime efficiently and accurately is of great significance for improving urban management and public safety. At present, it is difficult for most of the existing studies to obtain accurate crime prediction, because they usually utilize a single machine learning or deep learning model, ignoring the spatiotemporal dependence of the crime. In this paper, we propose a spatiotemporal prediction model GAERNN based on deep learning techniques. Firstly, the GAE model is used to capture the spatial distribution characteristics of crime cases. Secondly, the features with spatial dependencies are input into the GRU model after serialization to further extract the temporal features of crime sequences. Then, the spatial and temporal prediction results of theft crime are obtained by the fully connected layer processing. Finally, we select MLP and GCN to carry out contrastive experiments by using several indicators, such as RMSE and MSE, to verify the performance of our model. The results show that our model is significantly superior to other benchmark models in spatiotemporal prediction, and it can be used to prevent and control theft crime effectively.
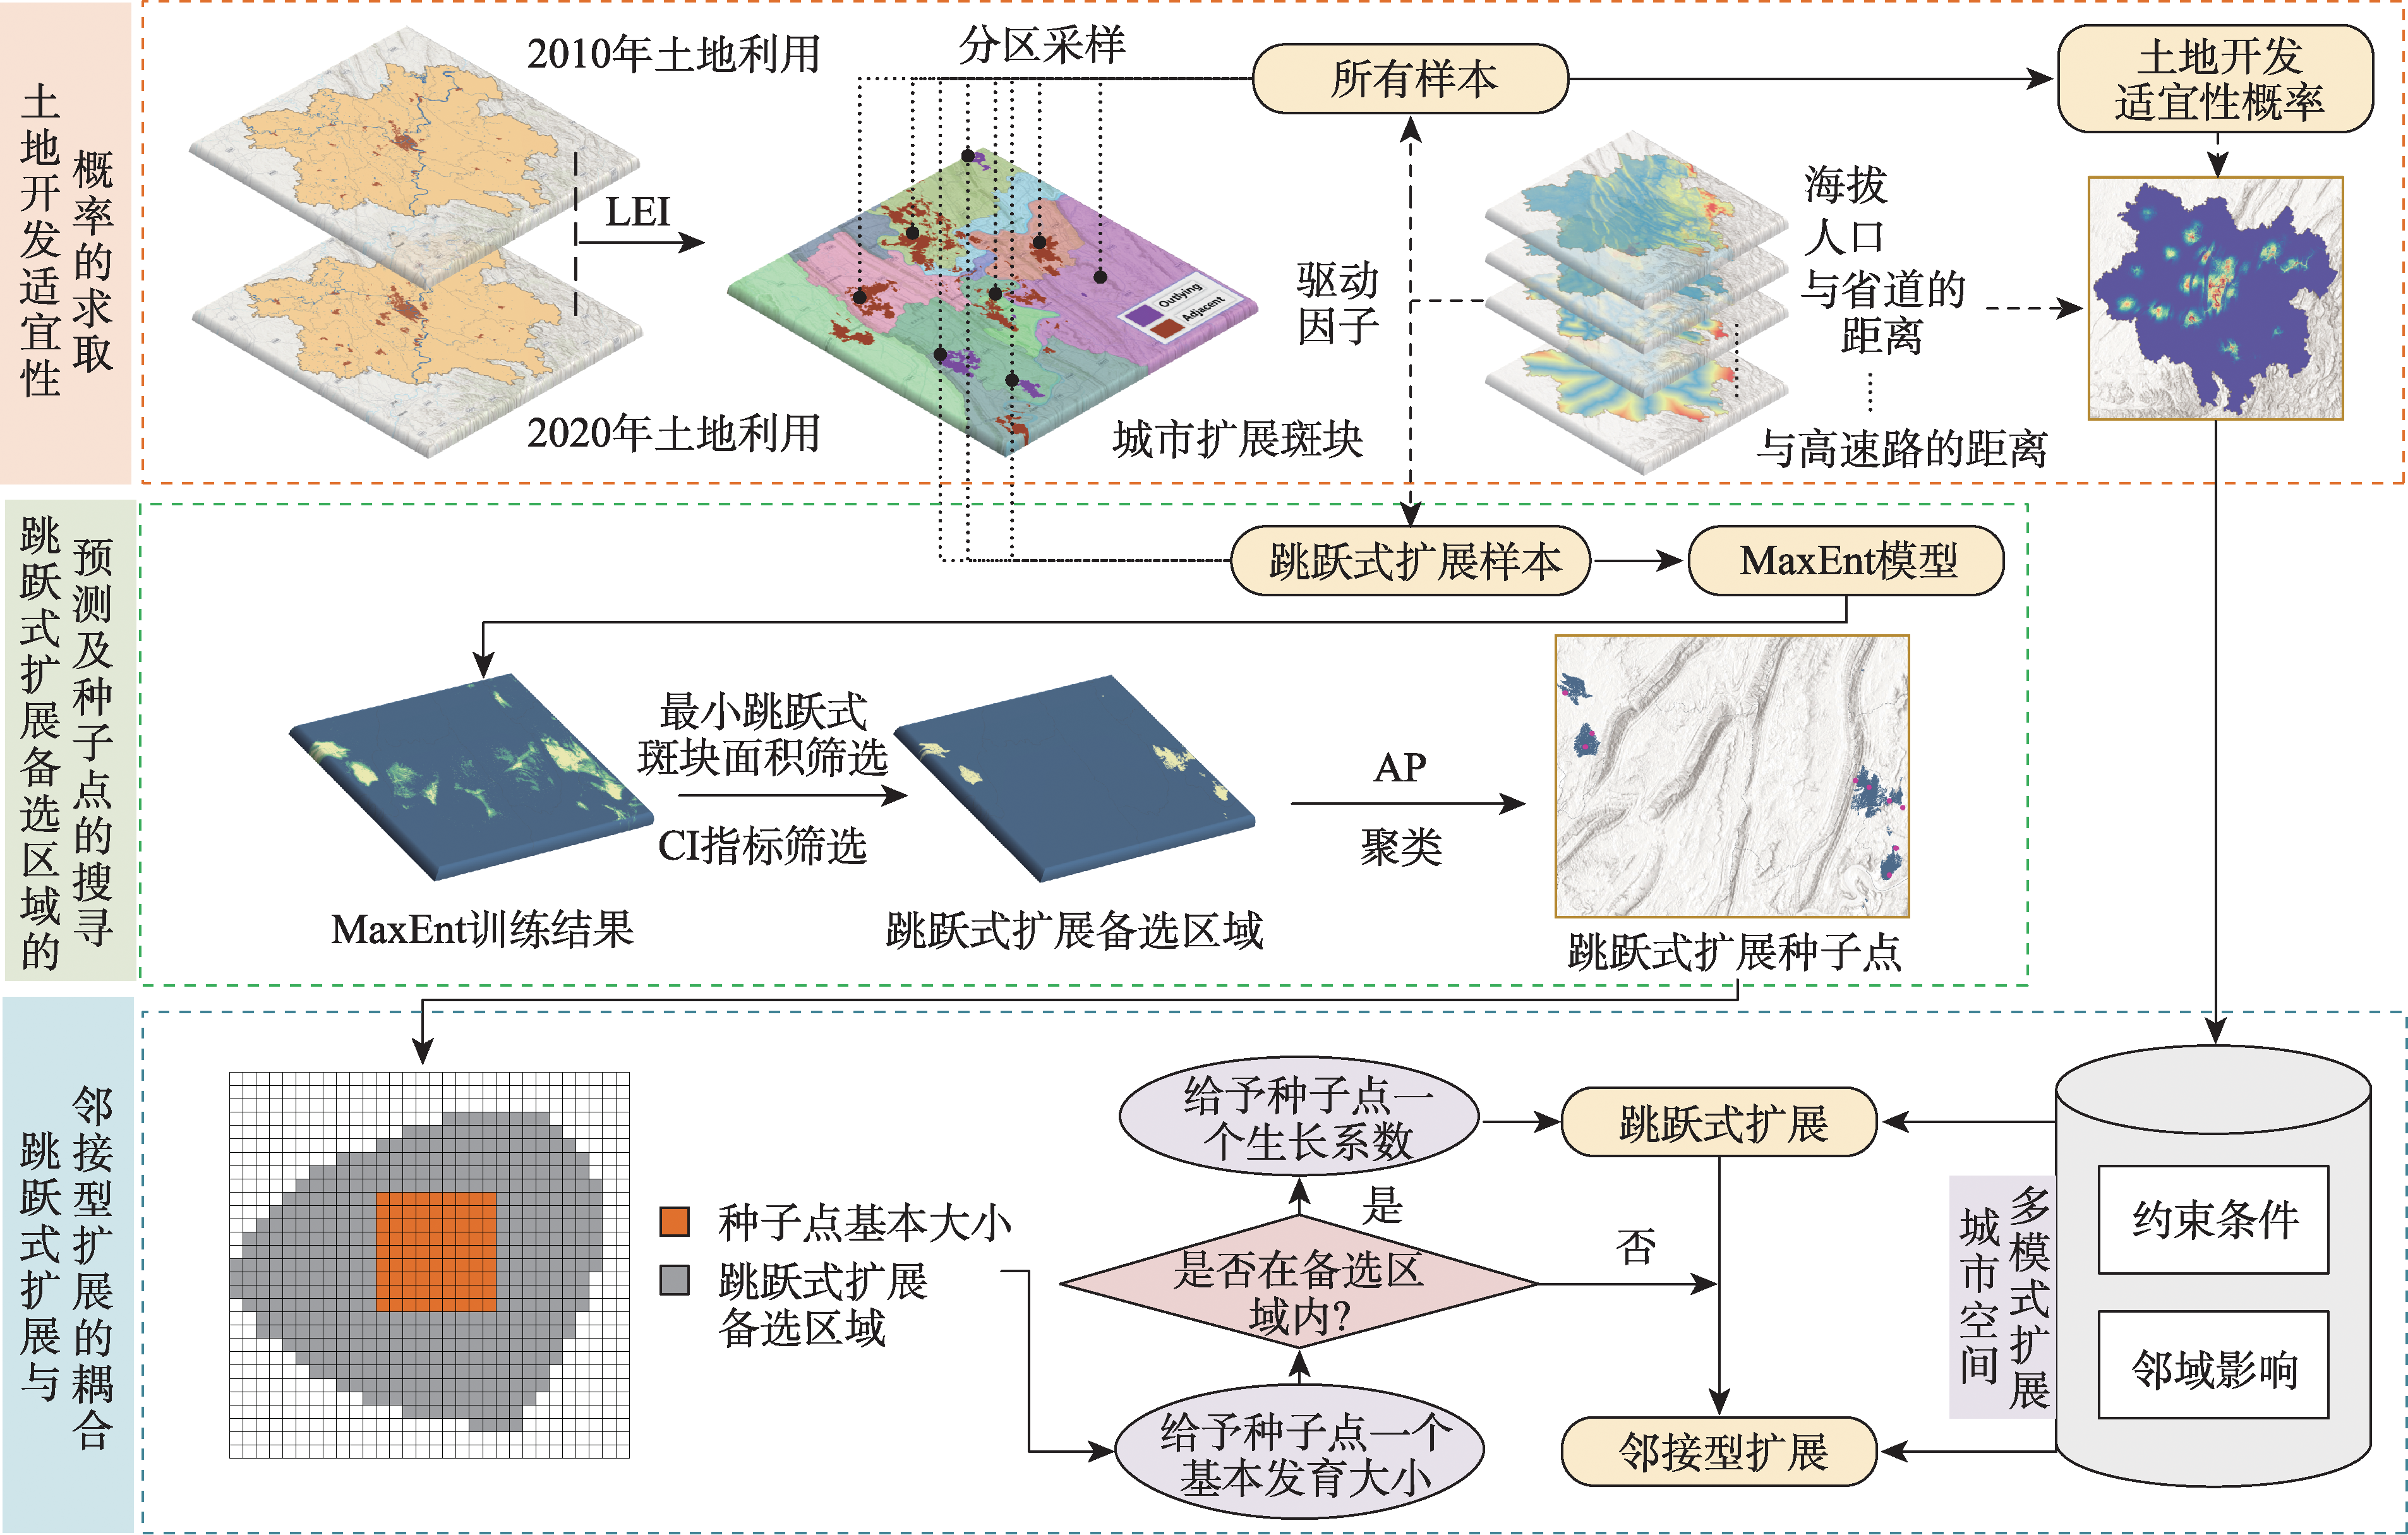
Development of multi-center clusters is an important way to optimize regional spatial structure, which results in various forms of urban space expansion, such as the adjacent type and the outlying type. Therefore, it is urgent to investigate the simulation techniques that takes into account the multi-mode expansion of urban space. However, it is still difficult to achieve the simulation of the outlying expansion in existing research, mainly due to the following problems: limited ability to show the urban growth process, large randomness of the selected "expansion seed points", and small application scale of models, etc. In this paper, a MaxEnt-AP-CA model coupling Maximum Entropy model (MaxEnt) and Affinity Propagation clustering (AP) is proposed. The MaxEnt model is used to find the alternative area of the outlying expansion, and the area and the compaction indices are used to screen the alternative area. In this way, the searching range of seed points is reduced, the randomness and the amount of data to be calculated are reduced, and the model is suitable for larger scale research. The AP algorithm is used to search for seed points in the alternative area, and these seed points grow outward from a basic size. Then the growth process of the outlying patch is demonstrated. Finally, by introducing the "growth coefficient", the conversion probabilities of different expansion modes are fused to realize the synchronous simulation of multi-mode expansion including the adjacent type and the outlying type. Taking the main metropolitan area of Chongqing as the research area, the Maxent-AP-CA is used to simulate the urban land expansion from 2010 to 2020. The results show that: (1) The accuracy of the seed points obtained by MaxEnt-AP that hit the actual outlying patch is significantly improved; (2) In terms of accuracy, the peak FoM of MaxEnt-AP-CA reaches 0.3061 with optimal parameters, which significantly improves the accuracy compared with the traditional CA model. In terms of landscape morphology, MaxEnt-AP-CA is closer to the actual situation in patch size, fragmentation degree, and aggregation degree, and can retain more patch shape features. The overall similarity between the optimal simulation results and the actual urban area is 87.04%. In terms of local details, MaxEnt-AP-CA can accurately show the outlying patches and express the real urban expansion more accurately; (3) MaxEnt-AP-CA gives consideration to multi-mode expansion, which conforms to the current situation of urban development in China and helps to promote the construction of a new urbanization pattern.
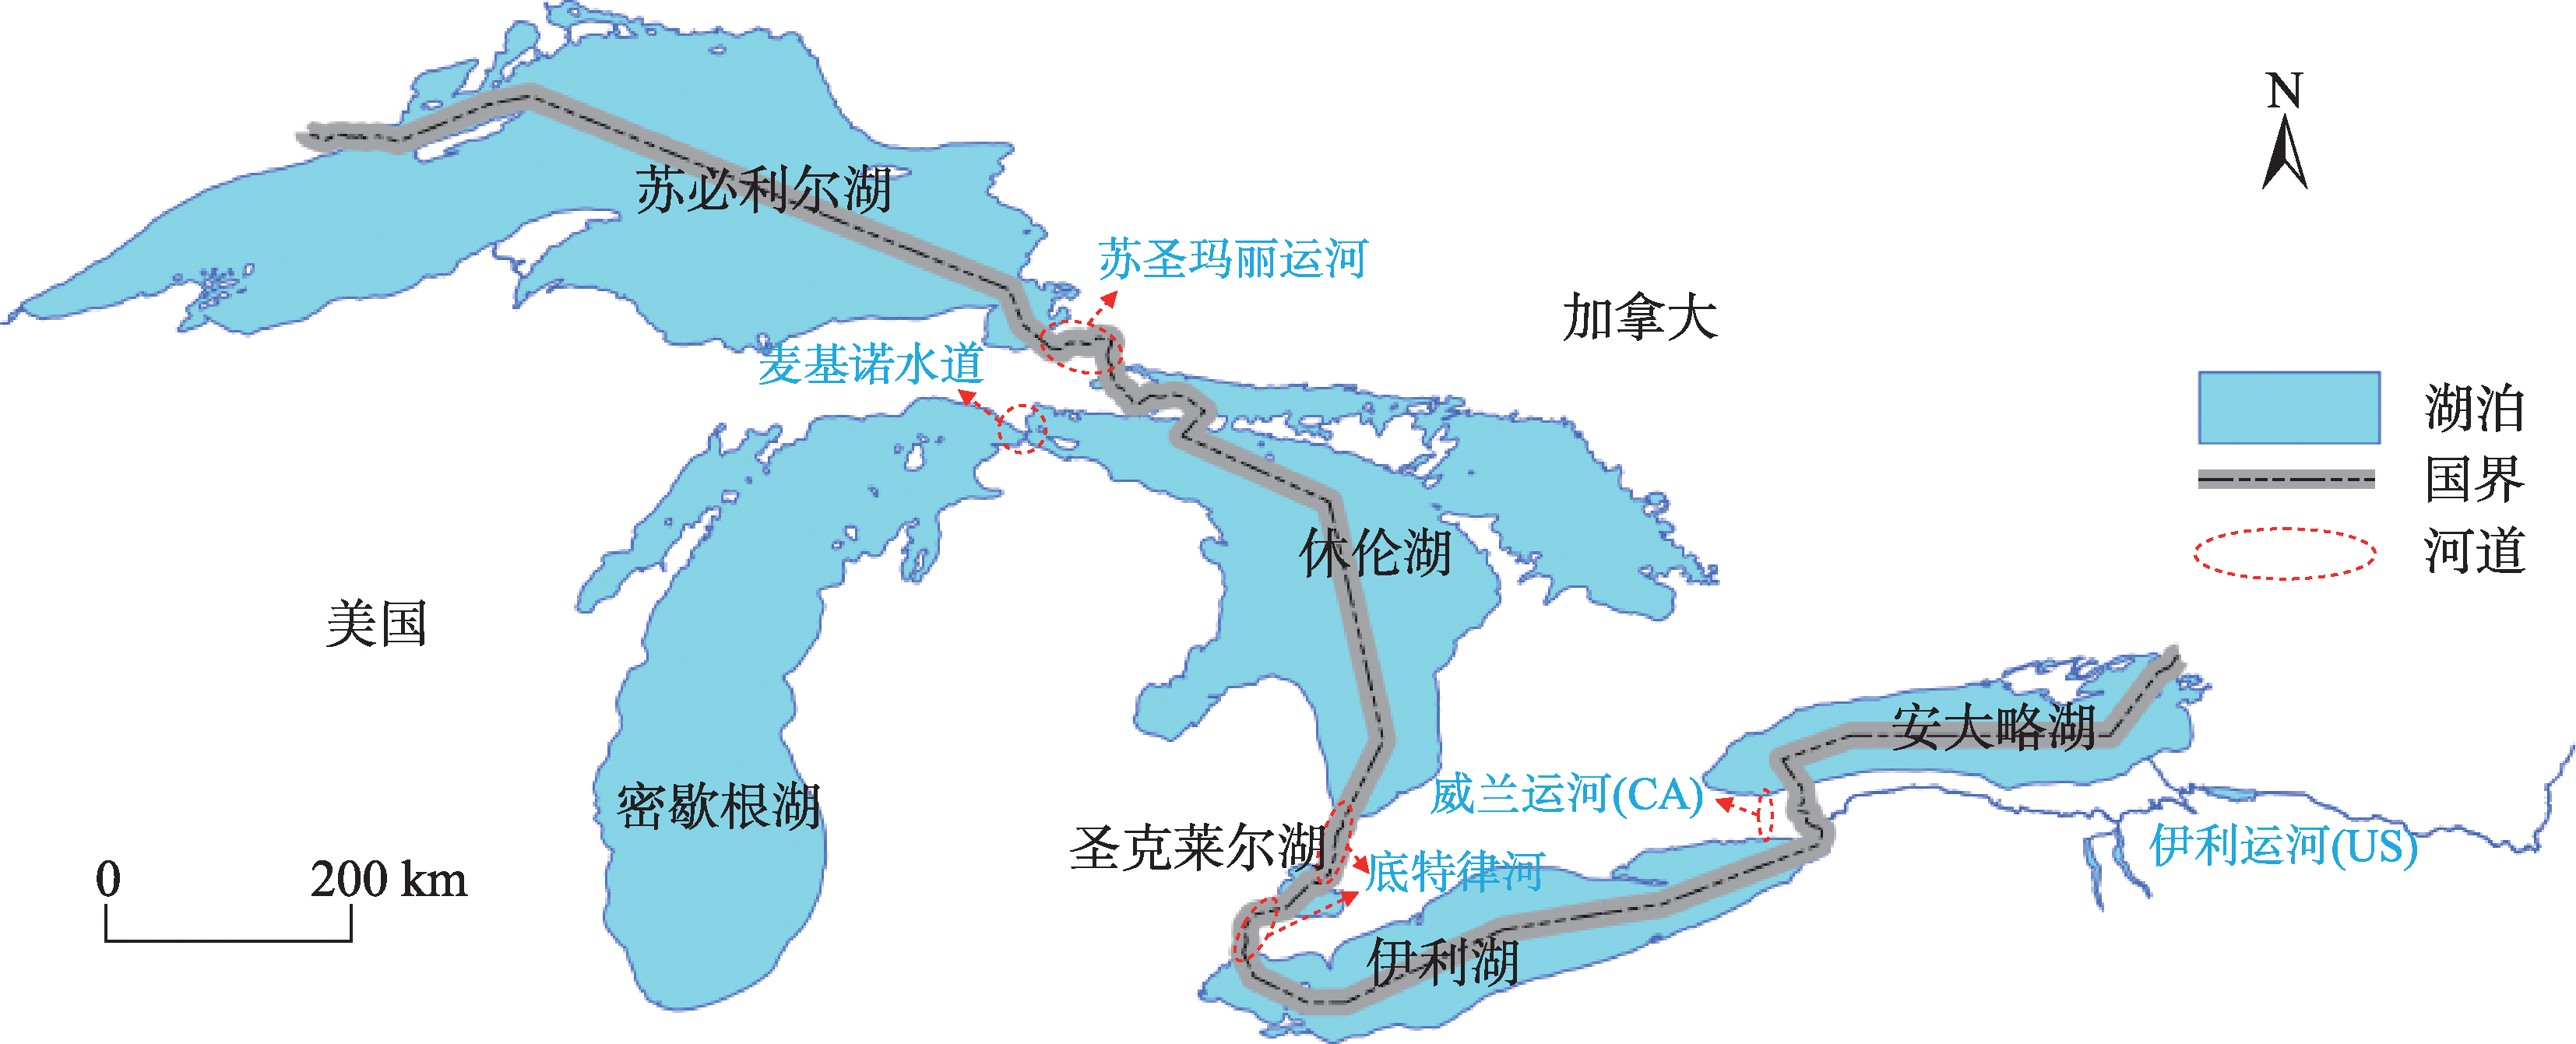
The COVID-19 pandemic has had a serious impact on the global maritime transportation industry, and there are new challenges and opportunities for the recovery of the shipping industry in the post-pandemic era. However, the limited time span of existing studies is insufficient to fully recognize the change in shipping network. Additionally, analysis of only macro-scale changes in spatial pattern ignores the intrinsic drivers of network changes. Therefore, based on the complex network theory, community detection algorithm, and TOPSIS analysis method, this study proposes a multi-scale change analysis framework for shipping network. The change characteristics of the shipping network, port community, and ports of three scales are analyzed using the North American Great Lakes ship trajectory data from 2019 to 2021. In addition, the change mechanism of each type of shipping is tracked. The results show that: (1) In terms of network traffic, freighters and tugboats accounted for 80% of the total traffic volume before the pandemic outbreak. After the pandemic, the total volume of ship traffic decreased by 22.4%. The change period and rate of the traffic volume of various types of ships are different. Cruise and cargo ships have strong recovery capability, followed by oil tankers, while passenger ships have the highest decrease in traffic volume with a decrease of more than 50% and have the weakest recovery capability. During the post-pandemic period, the total traffic volume increased by 4.4% compared to that before the epidemic, indicating that the overall network traffic recovery ability is strong; (2) In terms of network structure, before the pandemic, the shipping network showed an expansion trend with warmer temperatures, and the number of ports and routes increased incrementally. After the pandemic, the network structure was damaged, leading to a decreased connectivity. The route density increased, and the network "skeleton" was not destroyed during the period. Overall, the Great Lakes shipping network demonstrated strong resilience; (3) Large port groups in the Great Lakes region are located inside the major lakes with a stable spatial structure, and the key ports are located at the junctions of major lakes. The change of port evaluation values before and after the pandemic is complex and asymmetric. This study analyzes network changes from a multi-scale perspective, providing reference for practitioners to understand the impact of the pandemic on the shipping industry, and the method can be applied to other transportation network analyses.
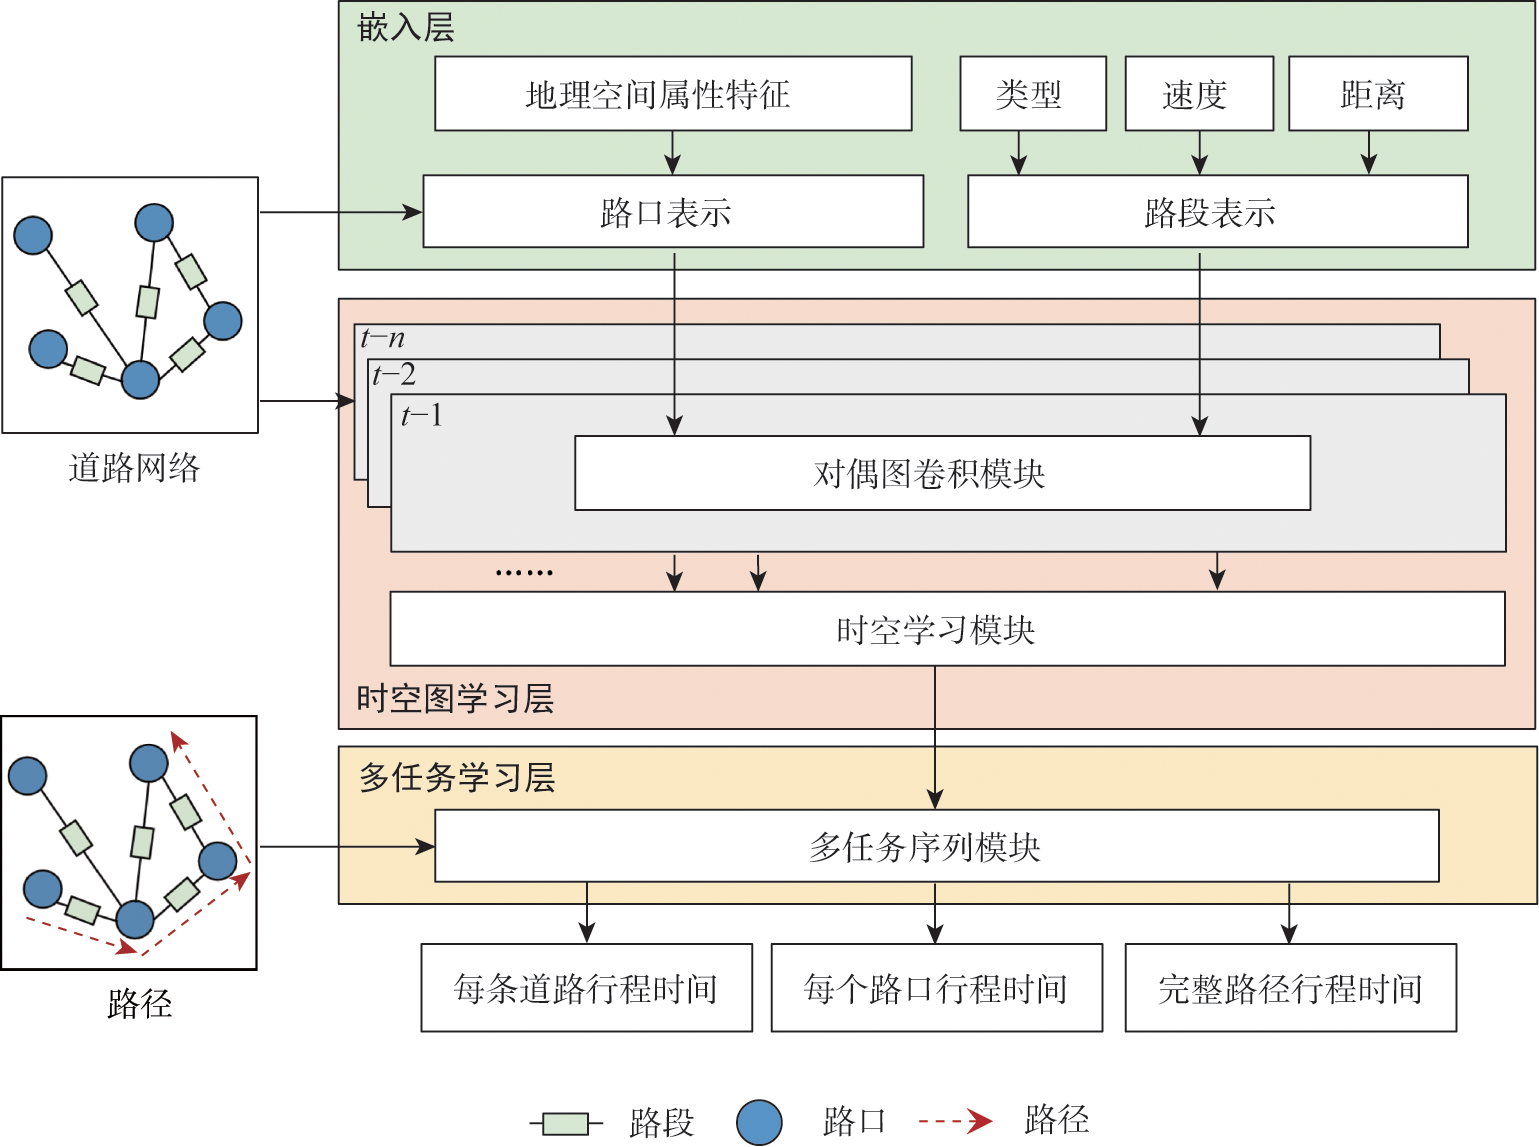
Estimating travel time for a given route plays an important role in many urban transportation systems, such as navigation and route planning. However, most of the existing works focus on modeling road segments or intersections individually, which cannot accurately estimate travel time, because intersections and road segments, as the basic elements of paths, not only contain diverse spatial attributes and temporal dynamics, but also have strong coupling correlation between them. To address the above problems, this paper proposes a novel end-to-end deep learning framework, Dual Graph Convolutional Network for Travel Time Estimation (DGCN-TTE), to jointly model intersections and road segments. Specifically, we adopt a dual graph convolution method to capture the complex relationship between intersections and road segments, in which a node-wise graph is constructed to characterize the correlation between intersections, and an edge-wise graph is constructed to characterize the interaction features between road segments. To capture the joint relationship of spatial and temporal features, we also introduce a spatiotemporal learning module that integrates multi-scale spatial relationships from multiple neighborhood scales while capturing temporal dependencies. This paper evaluates the proposed DGCN-TTE model through experiments on three real-world trajectory datasets, the results show that the proposed model significantly outperforms existing methods, and the evaluation metrics can achieve more than 10% improvement compared with the suboptimal method.
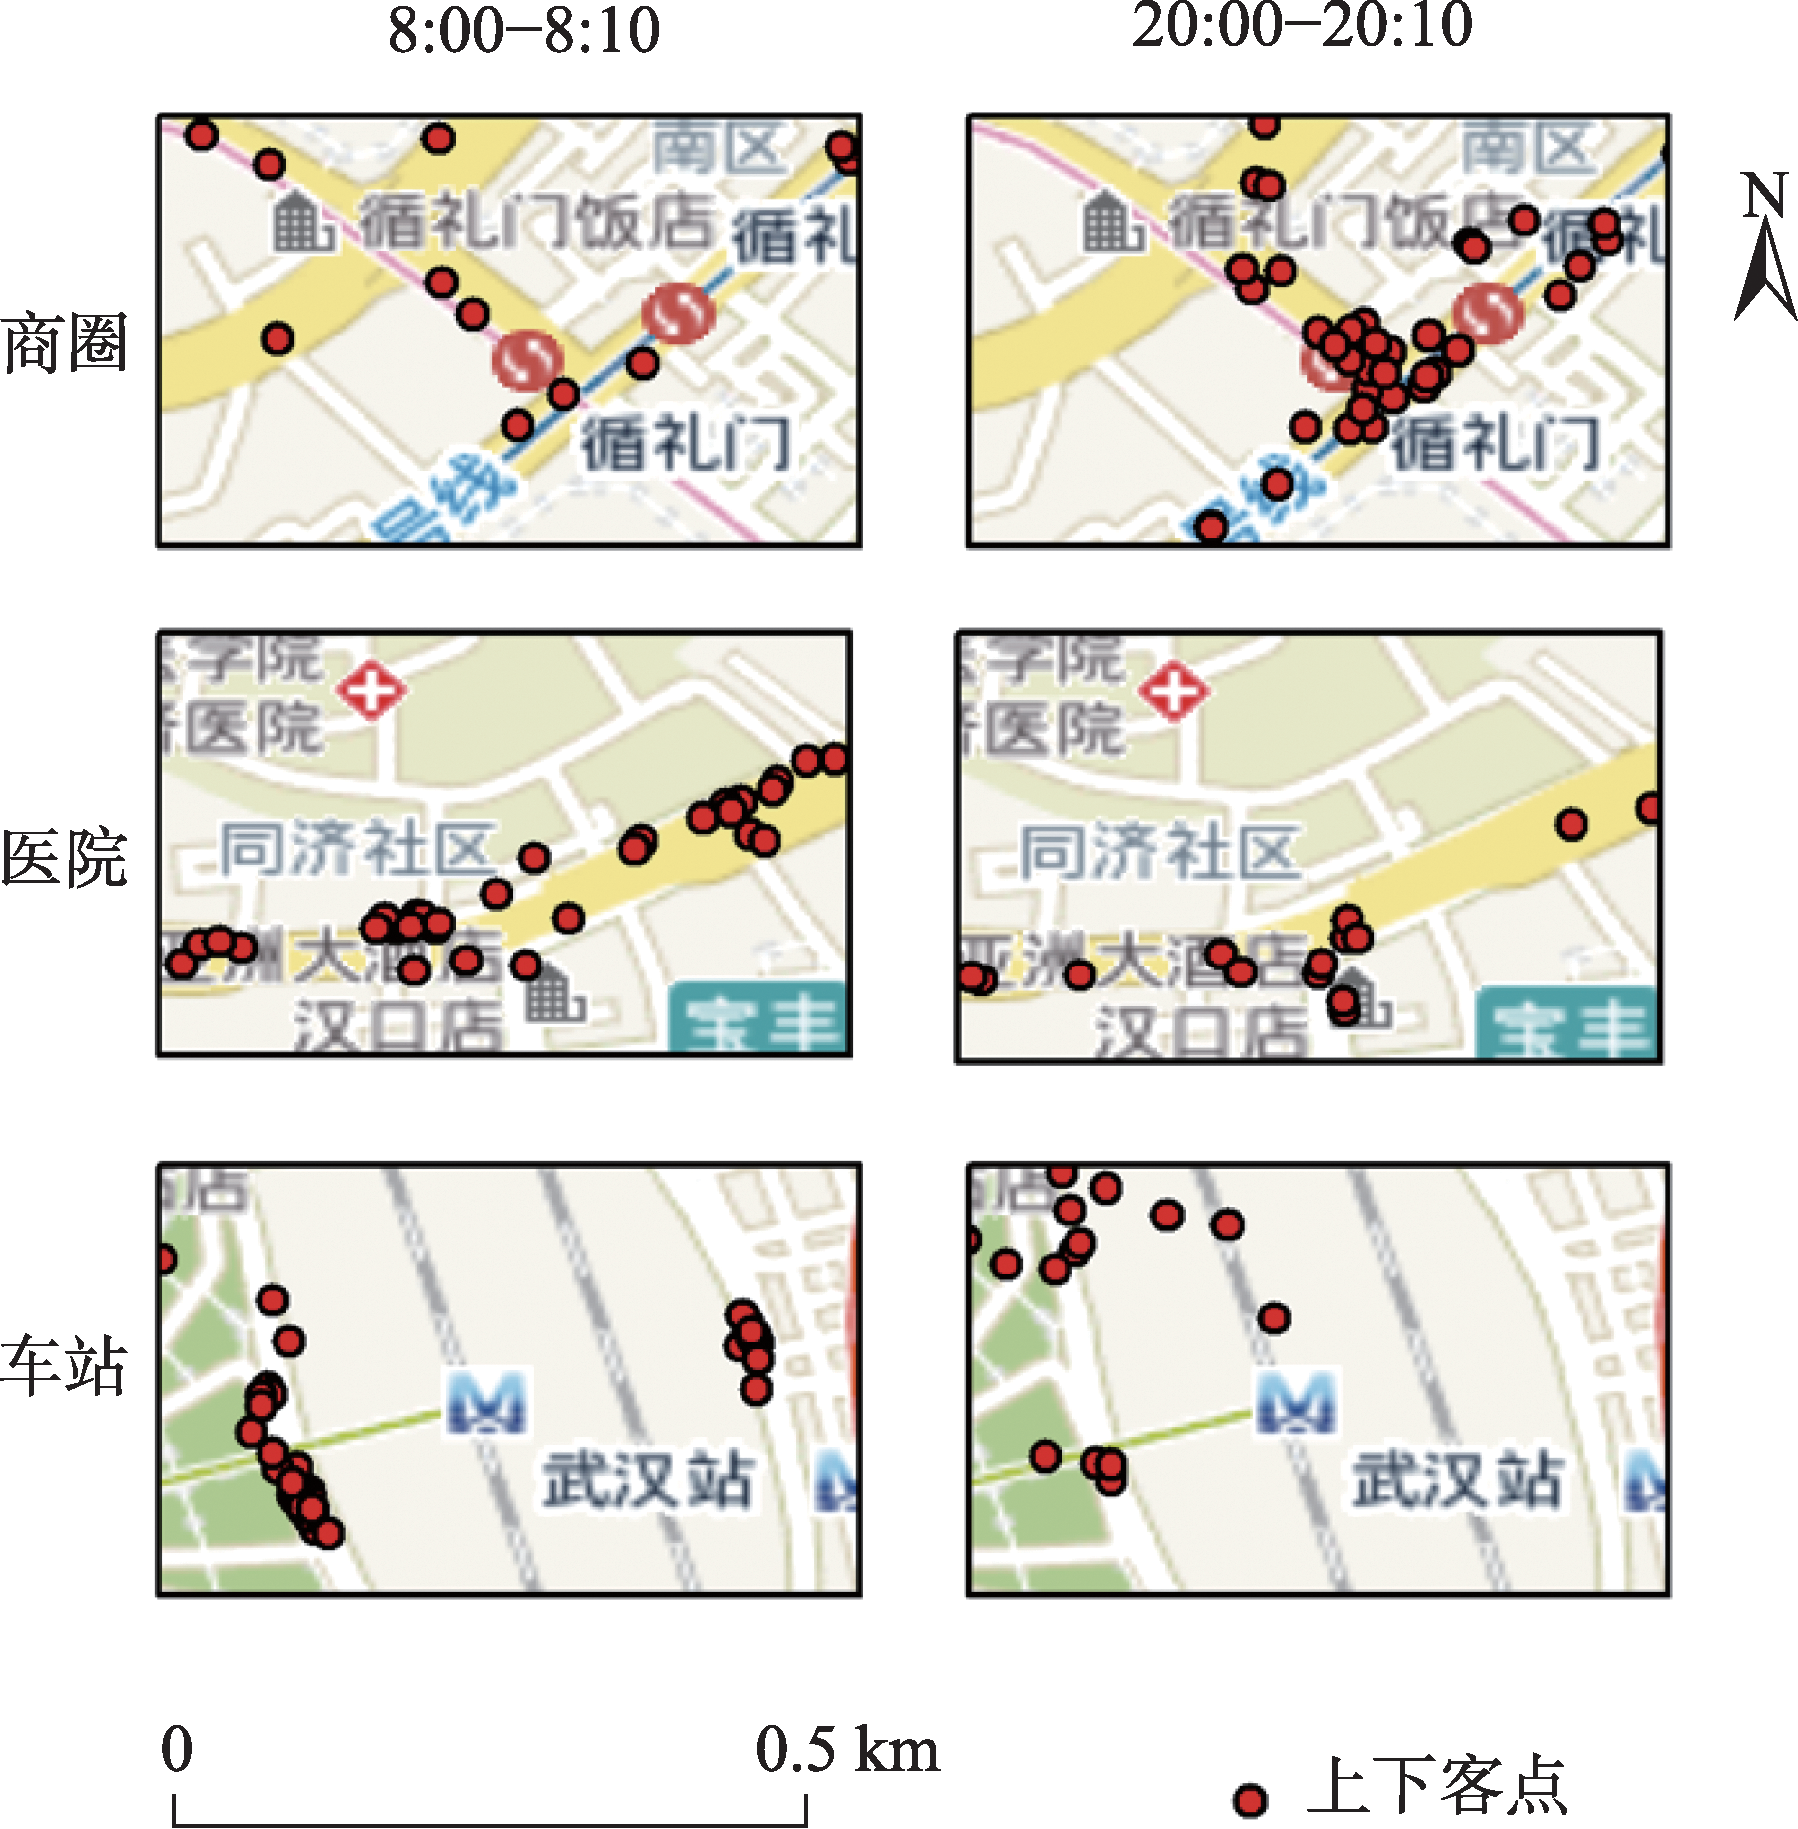
Real-time identification of urban hotspot areas can improve the response ability of city managers on emergencies. With the development of the Internet of Things and communication technology, the starting and ending information of taxi trips can be uploaded to the data center in real-time, forming a massive and continuous data stream of pick-up and drop-off events. Taxi is a welcoming means of transportation, and have characteristics of all-weather operation, full regional coverage, and high spatial-temporal resolution, so its pick-up and drop-off data stream can be used as a high-quality data source for real-time identification of urban hotspots. However, the hotspots area identification methods aimed at historical data sets have a high delay and can’t meet the real-time requirement. At the same time, the existing clustering algorithm based on distributed streaming processing technology is difficult to meet all the requirements including low aggregation cost, good scalability, and supporting arbitrary shape cluster recognition when facing pick-up and drop-off streams. Based on the distributed stream processing technology, an urban hotspot area identification method suitable for taxi pick-up and drop-off data stream is designed in this study. By mapping the real-time pick-up and drop-off records to grid monitoring units, we can obtain the heat value of each monitoring unit for each time window, filter the monitoring units which have higher heat values than a specified threshold as hot units, and finally gather the hot units of same time window into hotspot areas. To avoid the performance bottleneck of the aggregation operator in distributed region identification, a multi-stage distributed hot area aggregating method is designed. The method is implemented on Apache Flink, and the pick-up and drop-off data stream is simulated with the historical taxi trip records from Wuhan and New York City. The results show that: (1) The spatial distribution and status of hotspots differ from time to time, which is related to citizens' activities at different times; (2) Using smaller monitoring units can get finer spatial positions of each hotspot area; (3) Our method can accurately identify the hotspot areas using different parameter pair of monitoring unit sizes and hotspot thresholds; (4) The method has excellent throughput which increases with the computing parallelism and reaches 90k/s with parallelism at 8. The proposed method can correctly capture the spatial distribution of urban hotspot areas of each period in real-time and has good performance and scalability.